Solana Primed for $250 Surge as MACD Flips Bullish and RWA Hype Fuels Rocket Fuel

Solana's charts just flashed their most bullish signal in months—and real-world asset (RWA) mania might be the catalyst that finally sends it stratospheric.
The MACD's green light
That textbook momentum crossover traders live for? SOL just nailed it. The Moving Average Convergence Divergence histogram flipped positive for the first time since April, signaling institutional money creeping back in.
RWA: Not just another crypto acronym
Real-world asset tokenization projects on Solana have quietly onboarded $1.8B in Treasury bills and private credit since January. Traditional finance's slow dance with blockchain just turned into a Vegas chapel wedding.
Short sellers sweating
With open interest swelling and funding rates still negative, this setup reeks of a classic squeeze. The last time SOL saw this much suppressed demand? It ripped 300% in six weeks.
Of course, Wall Street will claim they saw it coming—right after they finish downgrading their price targets.

Solana is entering a critical phase where both technical and fundamental forces are starting to align. Momentum on the charts is building just as real-world asset (RWA) adoption gains pace, with tokenized stocks like AMZN and NVDA now riding on solana rails. At the same time, volume is ticking up, key resistance levels are being tested, and analysts are eyeing a potential breakout towards $250.
Tokenized Stocks on Solana Lead the Charge in RWA Growth
Tokenized stocks are quietly becoming one of the fastest-growing segments in crypto, and Solana is leading that trend. As highlighted by adamlawrencium, the top-performing tokenized assets are now mostly built on Solana, including AMZN, MSFT, and NVDA, all tracked via protocols like Backed Finance.
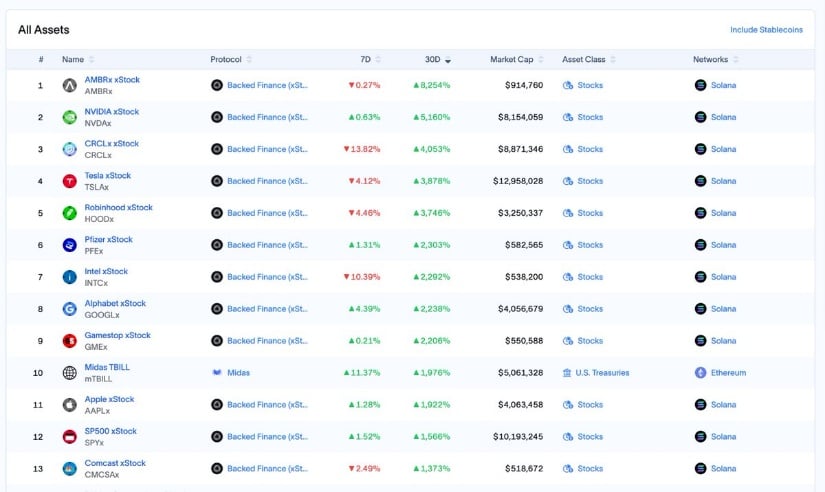
Solana leads the RWA narrative as tokenized giants like AMZN and MSFT gain traction on its network. Source: adamlawrencium via X
These aren’t memecoins or speculative plays, they’re representations of blue-chip stocks moving onto Solana rails with increasing velocity. With a growing market cap and broader visibility in DeFi circles, Solana’s edge in the tokenized asset space might become one of its most compelling growth reasons.
Solana Weekly Breakout Targets $250 as Resistance Flips to Support
Solana’s momentum continues to build, not just in tokenized assets but also on the price chart. As seen in the chart shared by Billions Crypto, SOL is now pushing above a long-standing horizontal resistance, attempting to confirm a clean weekly breakout. This level has capped previous rallies multiple times, and its reclaim suggests that bulls are starting to take control again. The candle structure shows strong follow-through and volume support, making the $170 to $180 zone the next area to watch. With Solana already powering real-world asset trends, a confirmed breakout here could accelerate its push back towards the $250 range in the NEAR term.
![]()
Solana reclaims major weekly resistance with strong volume, setting sights on the $250 target zone. Source: Billions crypto via X
Solana Clears 0.236 Fib as MACD Flashes Early Momentum Shift
Following up on Solana’s weekly breakout attempt, the lower-timeframe structure is starting to mirror strength. As highlighted by ConvictedTrader, the 45-minute chart shows SOL breaking above the 0.236 Fibonacci level at $187, with price pushing into a tight resistance cluster of moving averages. This kind of convergence often marks a critical inflection zone where breakout attempts either confirm or fail, and SOL’s ability to hold this level intraday could determine its next impulsive leg.
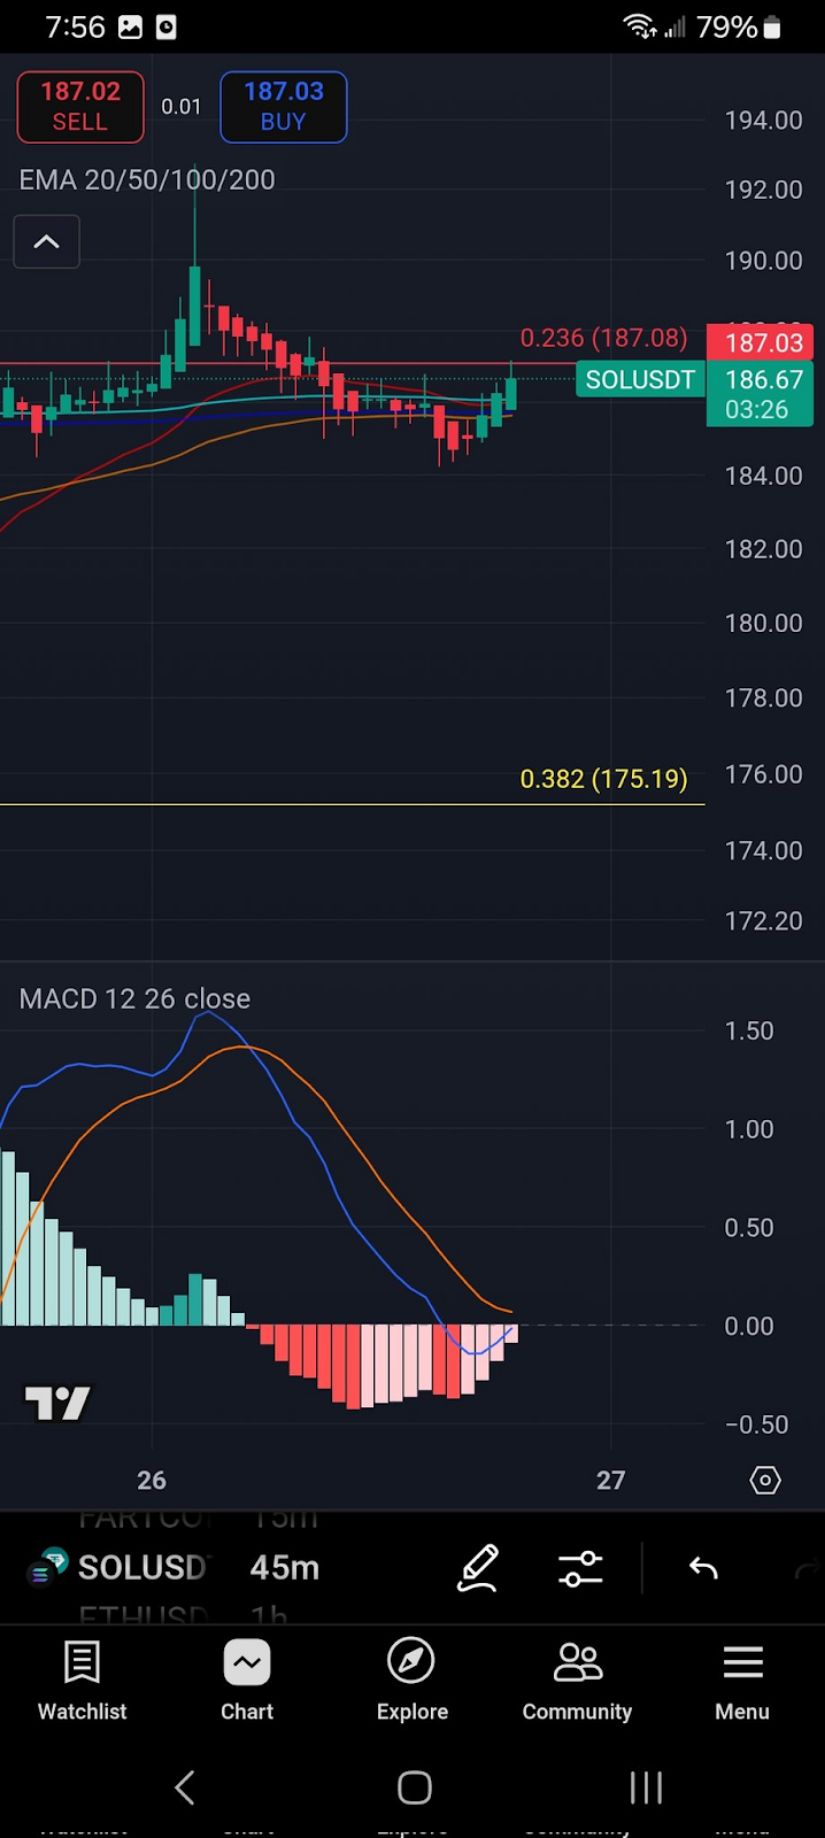
Solana breaks above 0.236 Fib with MACD flipping bullish on lower timeframe. Source: ConvictedTrader via X
The MACD is also showing early signs of bullish crossover, with the histogram flipping from red to green and the signal line curling upward. It’s not a full confirmation just yet, but the setup is starting to lean favorably for short-term momentum. With broader trends like RWA adoption on Solana and the recent weekly breakout, these micro-level technical shifts might be the fuel SOL needs to push through the final barrier toward $190 and beyond.
Solana Price Prediction Follows Global Liquidity Trendline
One overlooked factor in Solana’s recent strength might lie outside. The chart shared by CryptoCurb highlights a striking correlation between SOL’s price action and the Global M2 money supply with a 100-day lag. Historically, SOL has shown a tendency to follow the macro liquidity cycle, with major price uptrends aligning closely with rising M2. The current setup mirrors two previous pivot points where global liquidity expansion preceded explosive moves in SOL.
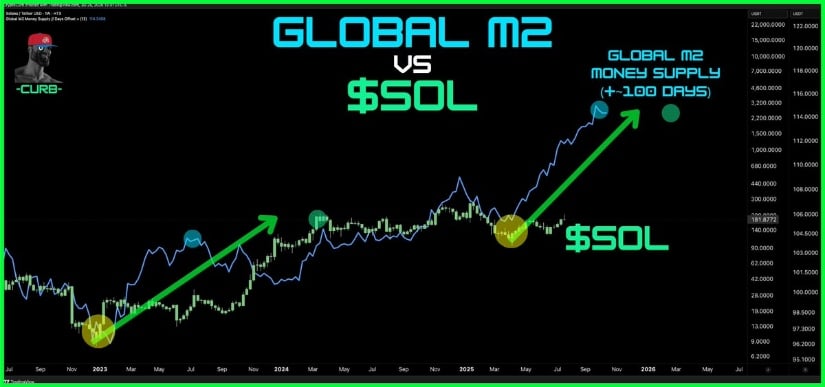
Solana tracks global liquidity trends, with M2 expansion hinting at a potential MOVE well beyond $250. Source: CryptoCurb via X
If that pattern holds, the latest surge in M2 could imply another major leg up for Solana. As we look ahead, this macro-influenced framework could support a solana price prediction well above $250, provided global liquidity continues its expansionary trend.
Final Thoughts
Solana isn’t just riding a short-term wave; it’s building momentum across multiple layers, from tokenized stocks to breakout technicals and even macro liquidity trends. The alignment of bullish chart patterns, rising volume, and real-world adoption is favoring a bullish Solana price prediction.
With SOL clearing key Fibonacci levels and the MACD hinting at a momentum shift, short-term targets near $215 to $250 remain in play. And if global liquidity continues to expand, the case for a much larger move grows even stronger.
