Hedera (HBAR) Primed for Breakout: $0.32 Resistance in Sight as Bulls Take Control

Hedera's HBAR is flashing bullish signals—traders are betting big on a decisive push past $0.32.
The Setup:
After weeks of consolidation, HBAR's chart shows a classic accumulation pattern. Whale wallets are loading up, and retail FOMO is creeping in.
The Catalyst:
Network upgrades and enterprise adoption whispers (because nothing pumps a coin like vague 'partnership' rumors). If momentum holds, we could see a 20% surge toward yearly highs.
The Catch:
Crypto being crypto, this could all evaporate faster than a meme coin founder's credibility. Watch the BTC correlation—because in this market, even the best alts kneel before King Bitcoin.

A recent surge has propelled the token into a high-volume cluster NEAR $0.30, signaling intensified accumulation and renewed trader interest.
Market participants now await a potential daily close above the $0.32 mark—a zone highlighted by analysts as a decisive breakout point. At the time of writing, HBAR is trading at $0.28542, maintaining structure above key dynamic support.
HBAR Tests Multi-Month Resistance with Momentum on Its Side
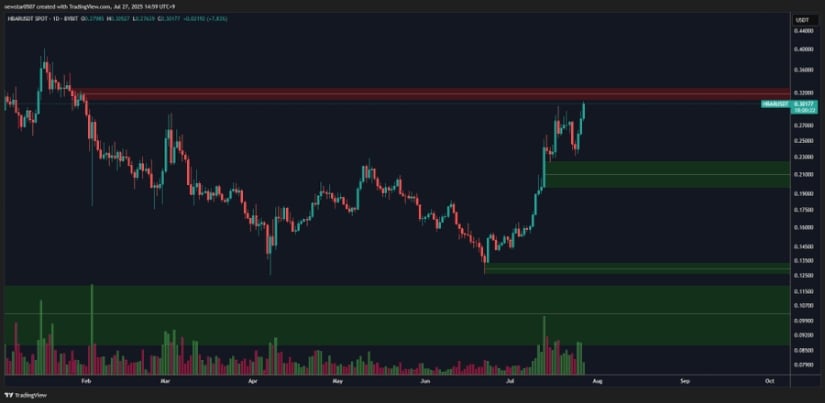
According to chart analysis by CW (@CW8900), HBAR is approaching a technical inflection point at $0.32. This level represents a long-standing supply zone where prior rallies have been rejected. The structure leading into this test shows a steady formation of higher lows and higher highs, characteristic of a developing uptrend.
The breakout attempt is supported by rising volume and positive sentiment, with analysts referring to the $0.32 mark as a “sell wall” that, once cleared, could validate a larger breakout structure.
Source: X
Multiple green demand zones marked on the chart—including $0.215–$0.230—reflect areas of earlier accumulation that provided the base for the current move. The volume surge that began in mid-July, coinciding with the recovery from this demand zone, adds technical weight to the breakout thesis.
If HBAR closes firmly above the $0.32 threshold and flips it into support, it may initiate the next leg toward historical resistance near $0.36–$0.40. A failed breakout, however, could prompt a short-term retracement toward support at $0.275–$0.280, where recent consolidation took place.
Strong Volume and Price Structure Fuel Bullish Case
Over the last 24 hours, HBAR rose by 8.61%, briefly touching $0.305 before settling near current levels. This MOVE was backed by substantial trading volume, with $1.11 billion traded during the period—nearly 10% of its $11.84 billion market cap.
Price action during the session reflected clear market control by buyers, forming clean higher highs and higher lows. Notably, the price did not sharply retrace from its peak, suggesting sustained demand rather than short-term speculation.
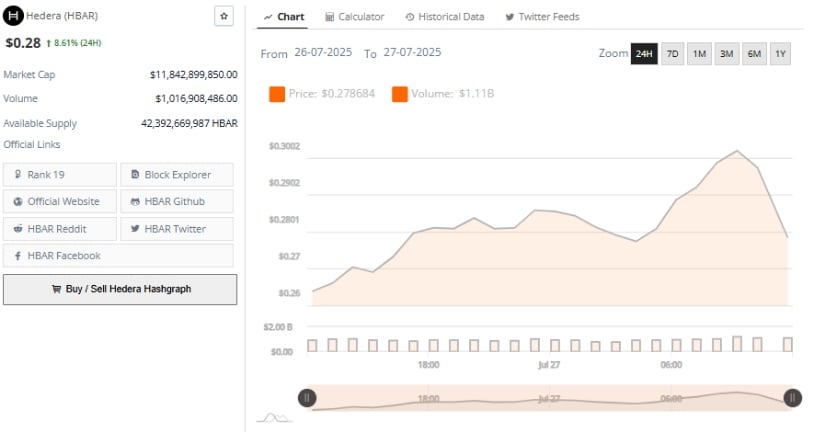
Source: BraveNewCoin
With a circulating supply exceeding 42.39 billion tokens, HBAR benefits from DEEP liquidity, which facilitates smoother price discovery during volatility. The support zone around $0.275–$0.280 remains critical for the short-term structure. As long as HBAR maintains above this area, the bullish trend remains intact. The volume pattern during this move supports the likelihood of further continuation, especially if a breakout above $0.32 is accompanied by expanding participation.
Technical Indicators Show Room for Further Upside
At the time of writing, HBAR remains well above its Bollinger Band basis line ($0.23940), currently trending in the upper third of the volatility bands. The upper band, now positioned at $0.31314, aligns closely with the resistance zone being tested.
This suggests a price expansion may be underway if volatility increases in the coming sessions. Bollinger Band widening indicates growing momentum and supports the continuation narrative, especially as HBAR maintains its position near its recent local high.
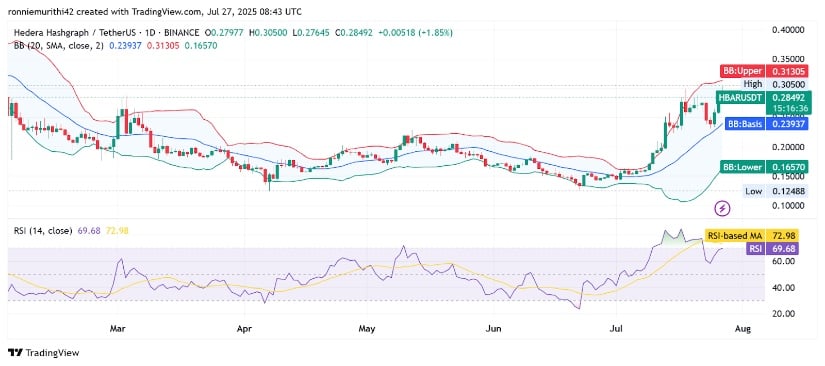
Source: TradingView
The Relative Strength Index (RSI) stands at 69.78, slightly below the RSI-based moving average of 72.99. This positioning shows bullish momentum remains strong, though the asset is nearing short-term overbought territory.
If the RSI reclaims levels above 70, it may serve as a confirmation of renewed strength and further price movement. Traders and analysts alike will be watching whether volume and RSI align with price to confirm the breakout or signal short-term exhaustion.
