🚀 Hedera (HBAR) Price Surge: Breaking the Wedge to Chase $2.00 in 2025’s Crypto Rally

Hedera smashes through technical resistance—bulls now eyeing a $2.00 price target as the wedge pattern collapses. Here’s why traders are flipping bullish.
### The Technical Breakdown
HBAR’s breakout isn’t just noise—it’s a textbook wedge escape, the kind that gets chartists buzzing. No fluff, no maybes: the pattern’s broken, and the path is clearing for a run-up.
### Why $2.00 Isn’t a Fantasy
With the crypto market shrugging off regulatory FUD (again), HBAR’s momentum could snowball. Retail’s late as usual, but the whales? They’re already positioning.
### The Cynic’s Corner
Let’s be real—another ‘breakout’ in a market that treats TA like horoscopes. But hey, even broken clocks are right twice a day. This time, the math might just stick.

With heightened trading volume and a clear upward trend, analysts are now monitoring the token’s path toward the $2.00 mark. The market reaction suggests sustained demand and institutional interest.
Falling Wedge Breakout Sparks Aggressive Weekly Rally
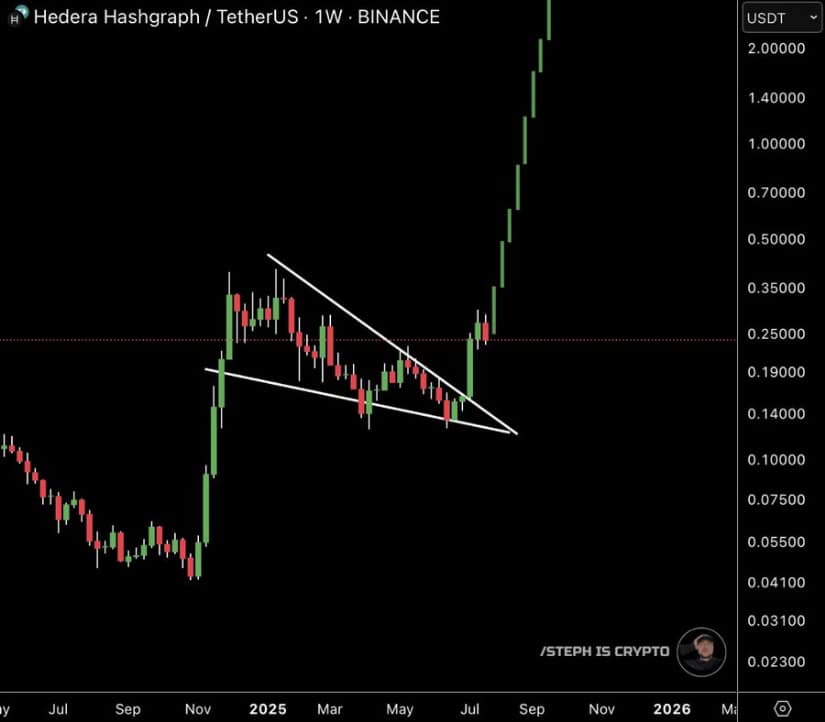
The weekly HBAR/USDT chart shows a confirmed breakout from a long-standing falling wedge formation. This technical setup, which spanned from February to mid-July 2025, typically signals a reversal in trend when the price closes above the upper boundary.
The wedge’s breakout was validated by a strong bullish candle, which pushed the price above $0.25 and triggered rapid gains. This breakout marked the end of a consolidation phase that had persisted for several months.
Source: X
The current weekly structure features consecutive large green candles, suggesting strong upward momentum. HBAR has surged past historical resistance levels at $0.35 and $0.50 and is now approaching the psychological threshold of $2.00.
Notably, the absence of upper wicks on recent candles reflects low selling pressure. Such price behavior typically indicates solid buyer control and a high probability of trend continuation if no external disruption occurs.
Daily Chart Confirms Short-Term Strength with Volume Support
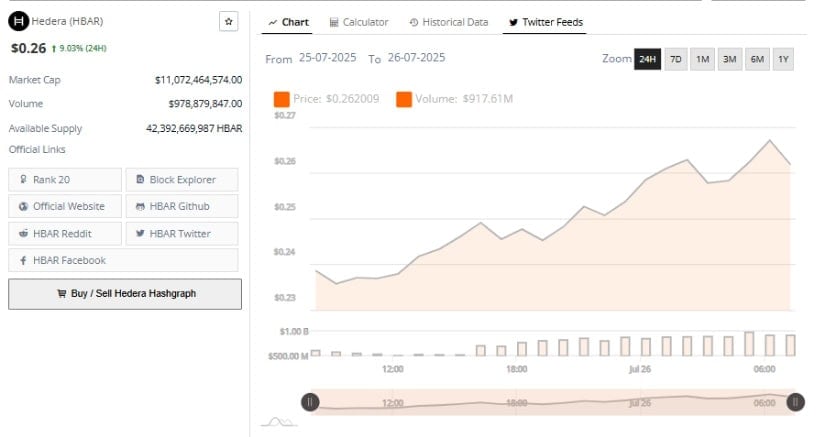
HBAR also displayed strength on the 24-hour chart, gaining 9.03% to reach $0.26. The price advanced steadily from $0.23 with minimal volatility, highlighting consistent accumulation. Trading volume ROSE in parallel, reaching $978.78 million, which supports the validity of the uptrend. Price behavior during this period did not feature sharp corrections, suggesting limited speculative movement and more structured demand.
Source: BraveNewCoin
The market capitalization currently stands at $11.07 billion, supported by a circulating supply of approximately 42.39 billion HBAR tokens. The breakout above the $0.24 resistance level, which has now turned into support, reflects growing interest among investors.
If the price maintains above $0.26 with continued volume strength, the next resistance zone, NEAR $0.27, may be tested shortly. A breakdown below $0.24, however, could signal a shift toward short-term consolidation.
Momentum Indicators Show Continued Inflow and Potential for Expansion
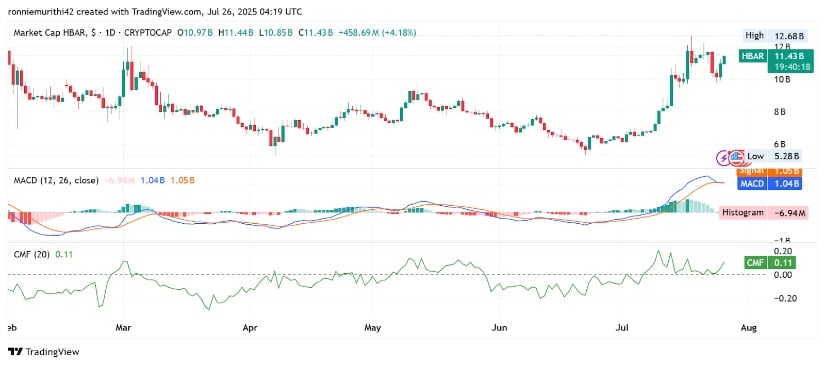
At the time of writing, HBAR has a market capitalization of $11.33 billion, following a 3.27% daily gain. The token recently revisited its local high near $12.68 billion before undergoing minor profit-taking.
The MACD indicator on the daily chart shows that the MACD and signal lines are nearly aligned, with a histogram reading of -13.32M. This suggests a temporary decline in momentum without signaling a reversal. Earlier in July, the MACD crossover triggered a strong bullish impulse that remains intact.
Source: TradingView
Additionally, the Chaikin Money FLOW (CMF) reading of +0.10 indicates a sustained capital inflow into the asset. A CMF above 0 supports the view that accumulation continues to outpace distribution.
This condition has been consistent for most of July, reflecting ongoing investor confidence. Should the MACD histogram turn positive again while CMF remains elevated, HBAR could revisit its recent market cap high and potentially target a new breakout.
