Cardano (ADA) Primed for $1.20 Surge as Global Liquidity Meets Bullish Wedge Breakout

Cardano's ADA isn’t just knocking on the door of $1.20—it’s booting it down with macro tailwinds and a textbook technical setup. Here’s why traders are flipping bullish.
The Liquidity Pump Nobody Wants to Admit
Global cash sloshing around like a drunk whale at a crypto conference? Check. Central banks pretending inflation is ‘transitory’ while printing faster than a Bitcoin miner’s GPU? Double check. ADA’s poised to ride the wave.
Wedge Play: The Chart Whisperer’s Dream
That descending wedge everyone’s been side-eyeing? Breaking north like a DeFi degens chasing the next APY farm. Historical precedent says this could send ADA on a tear—assuming the Fed doesn’t yank the punchbowl again.
The Cynic’s Corner
Sure, $1.20 looks juicy—until some hedge fund ‘risk manager’ blames ‘unforeseen market conditions’ (read: their algo shorted the wrong asset). But for now? The charts say buy. The macro says buy. Even your Uber driver’s ‘crypto advisor’ cousin says buy. Just maybe take profits before the suits ‘discover’ volatility again.

Cardano price structure is pointing to a classic setup unfolding, a tightening wedge structure, a strong weekly trend, and a growing liquidity pocket forming just above key resistance. Add in global liquidity turning higher, and ADA could be quietly setting the stage for a major breakout.
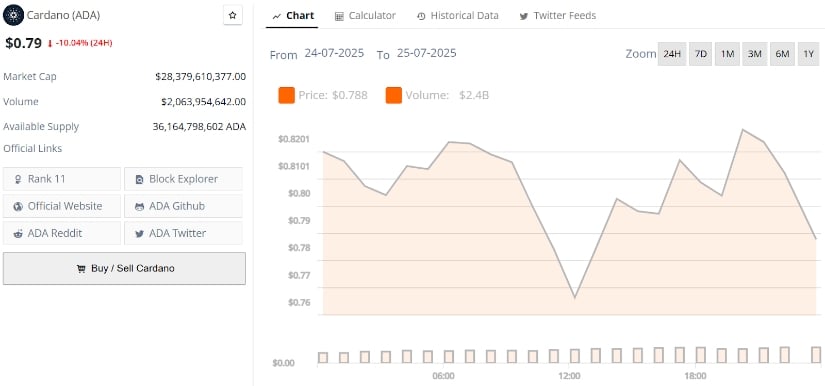
Cardano’s current price is $0.79, down -10.04% in the last 24 hours. Source: Brave New Coin
Cardano Price Action: Short-Term Weakness, Long-Term Strength
The latest chart shared by Blockchain shows a clear split between short-term and long-term trends for Cardano. On the daily timeframe, price is moving lower, reflecting short-term weakness. But when zooming out to the weekly chart and monthly chart, the trend shifts bullish with a steady uptrend and growing momentum.
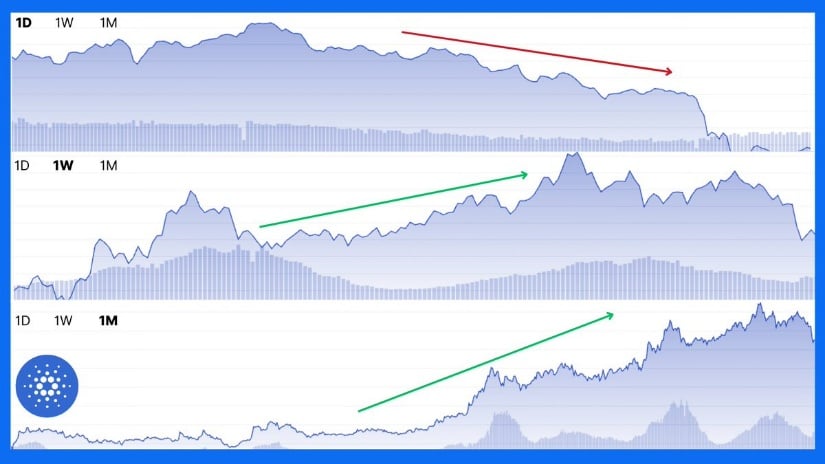
Cardano’s multi-timeframe chart shows short-term weakness but a steady uptrend on weekly and monthly views, signaling long-term strength. Source: Blockchain via X
In market structure, higher timeframes always carry more weight. So while the daily dip might catch attention, the bigger picture suggests ADA remains on solid ground. If the weekly and monthly trends continue to hold up, the current short-term pullback could simply be part of a healthy consolidation before the next leg up.
Cardano Price Rejected at Resistance, But Structure Remains Intact
Cardano price faced a textbook rejection from its descending resistance trendline, as highlighted in SnekArmy’s chart. The rejection aligns with a clean three-touch structure, forming a long-standing trendline that price has respected since early 2025. While the immediate reaction is a pullback, structurally, ADA has not broken down. Instead, it remains within a tightening wedge.
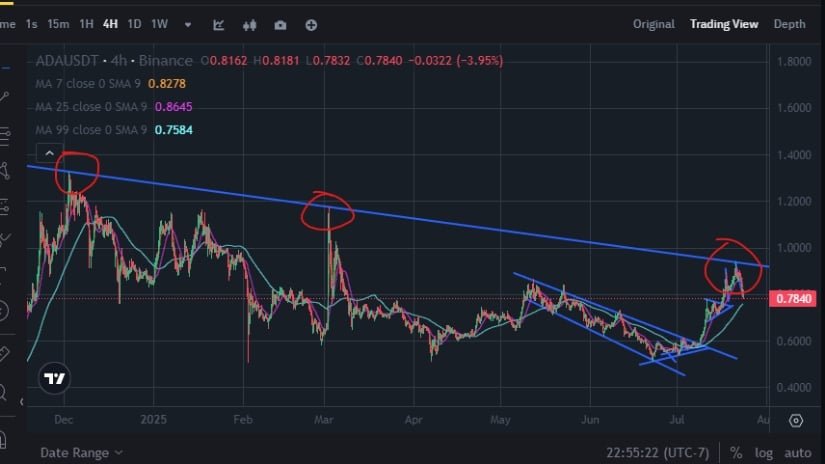
Cardano gets rejected at a key trendline for the third time, but price action still respects the wedge structure. Source: SnekArmy via X
This rejection doesn’t undermine the broader bullish setup noted earlier. The higher timeframes, weekly and monthly, still show strength, and price is gradually working its way back to retest this descending structure. If ADA can reclaim the recent high on the next attempt, it opens the door towards the $1.20+ zone.
Cardano Liquidity Layer Builds Above $0.855
Fresh heatmap data shared by Carlos Garcia Tapia highlights a growing cluster of liquidations stacked just above the $0.855 zone. This area now represents a liquidity pocket, typically a magnet for price, where stop orders from overleveraged short positions are placed.
From a structural point of view, this aligns well with the previous descending resistance line, reinforcing the importance of that region in the next move.
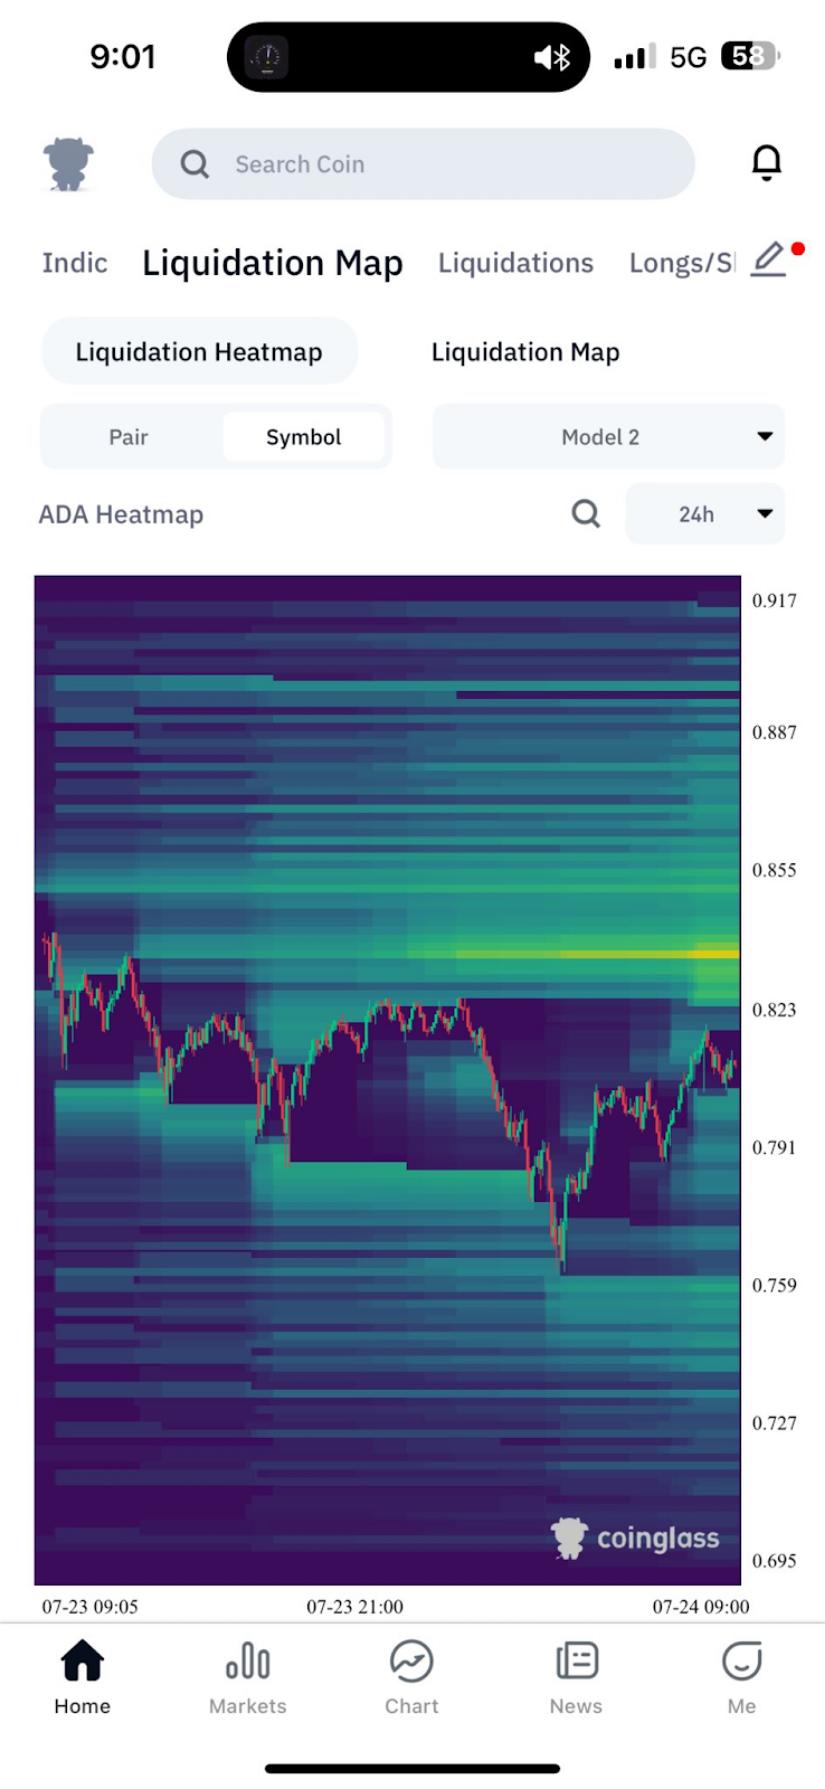
Cardano heatmap reveals liquidation cluster above $0.855, creating a key target zone for potential bullish continuation. Source: Carlos Garcia Tapia via X
In the context of recent rejection and short-term pullback, this heatmap zone could become the next logical target if bulls regain control. As noted in earlier breakdowns, the broader trend on weekly and monthly remains intact, and a move through this liquidation LAYER could serve as a springboard for a stronger upside continuation.
Cardano Price Prediction: Global Liquidity Alignment Adds Fuel to Upside Case
A fresh chart from Bull Bear Spot overlays Cardano’s price action with M2 global liquidity, a macro metric that often reflects broad market expansion. Historically, ADA has shown a strong directional relationship with this liquidity trend, and once again, the two are syncing up. As seen in the chart, when global liquidity turns higher, ADA tends to follow suit. With the yellow M2 curve currently breaking into new territory, the implication is clear: ADA may not be far behind if this correlation holds.
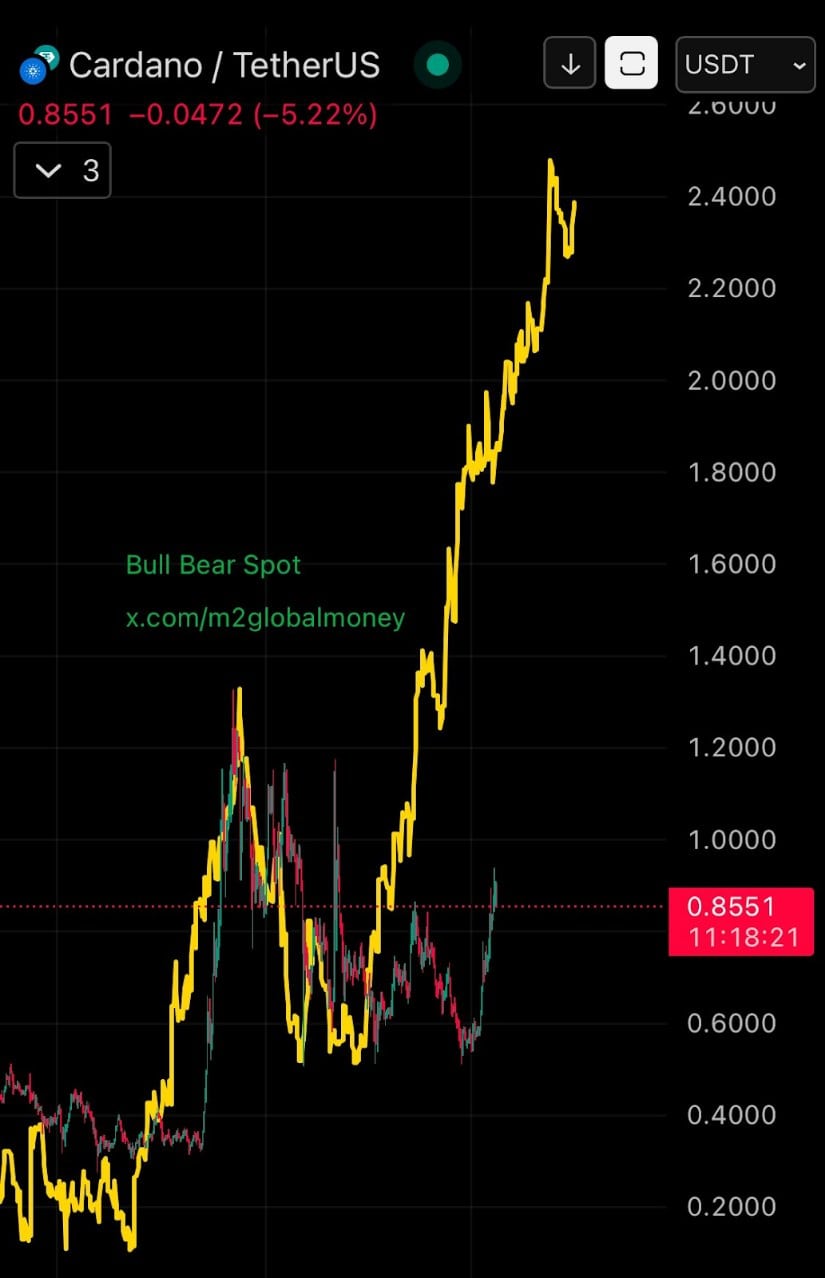
Cardano’s price action aligns with rising global M2 liquidity, historically a strong macro signal for major upside moves. Source: Bull Bear Spot via X
This perspective adds another layer to the higher timeframe strength. While ADA recently pulled back from local resistance, its structural setup remains healthy. If the global liquidity curve continues pushing upward, it could provide the macro tailwind needed for ADA to reclaim the $1.00 mark and eventually target the $1.50 and $2.00 zone.
Final Thoughts
While Cardano’s short-term dip might’ve raised a slight caution, the broader narrative still leans bullish. ADA is seeing a higher timeframe structure hold firm, wedge formations staying intact, and even global liquidity tilting in ADA’s favor.
