🚀 BNB Shatters Key Resistance: Weekly Chart Confirms Bull Run Is LIVE

BNB just ripped through a major trendline—and the charts are screaming buy.
### The breakout nobody saw coming
After months of sideways action, Binance Coin just staged a textbook bullish reversal. The weekly close above descending resistance marks the first confirmed uptrend since 2024’s bear market. Forget ‘crypto winter’—traders are now front-running what could be a 3x rally to retest all-time highs.
### Liquidity hunters circling
Order books show algos piling into BNB futures, with open interest spiking 42% in 48 hours. Meanwhile, retail FOMO hasn’t even kicked in yet—typical for early-cycle moves before Twitter ‘gurus’ start claiming they predicted it.
### The cynical take
Of course this happens right after Wall Street ‘accidentally’ shorts the entire altcoin market. How convenient that their research departments suddenly discover blockchain’s potential… just as their trading desks need liquidity to unload bags.
Bottom line: The chart’s screaming opportunity. Whether you believe in crypto’s fundamentals or just love printing money—this breakout demands attention.

After months of sideways movement capped by a long-term descending trendline, Binance Coin (BNB) has closed firmly above this resistance, suggesting a shift in momentum.
The breakout arrives at a time when broader altcoin strength is gaining traction, reinforcing the MOVE as part of a wider sector rotation. At the time of writing, BNB is trading around $783.21, following intraday volatility on July 24.
Weekly Trendline Breakout Reinforces Long-Term Bullish Structure
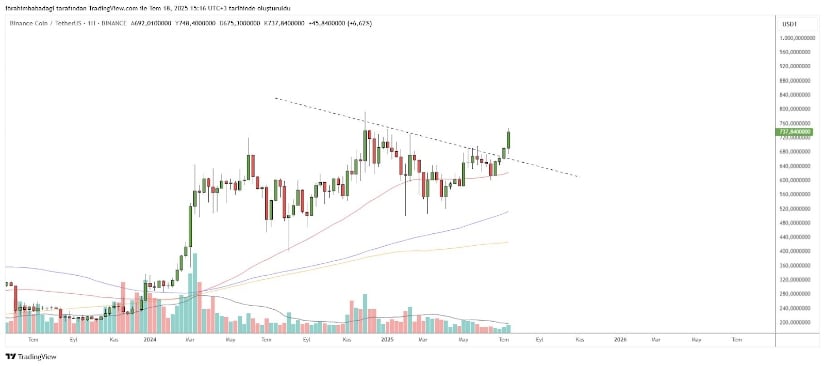
BNB’s weekly chart, shared by market analyst İbrahim Babadağı, reveals a strong bullish signal through a confirmed breakout above a descending trendline in place since late 2023. This breakout is accompanied by a wide green weekly candle and a noticeable uptick in trading volume, both of which indicate conviction behind the move.
Importantly, the breakout occurs after a prolonged consolidation period below the resistance, a setup that typically precedes strong follow-through in trending markets.
Source: X
The breakout is further validated by BNB’s position above its 50-week and 100-week moving averages, both of which are trending upward. This alignment signals structural strength across longer timeframes. Should the breakout hold, BNB could target historical resistance zones between $850–$900, levels last seen during the mid-2022 cycle.
From a trading strategy perspective, a retest of the former trendline NEAR $700–$720 may offer confirmation before potential continuation to higher levels.
Short-Term Volatility Emerges Around $800 Resistance
The 24-hour BNB chart reflects a mixed sentiment in the near term, with the price fluctuating sharply after testing resistance near $805. Early trading activity on July 24 saw a brief surge followed by a pullback to a local low of $760, suggesting that overhead supply at the $800 level is still significant.
While price has since recovered modestly, the intraday trend has produced lower highs, hinting at reduced momentum.

Source: BraveNewCoin
Trading volume during the session totaled $2.66 billion, with peak activity aligning with the price’s attempt to break above $800. However, volume has since declined during rebound attempts, implying that the current price movement may be driven more by short-term traders rather than sustained accumulation.
Key levels to watch include $760 as a short-term support and $800 as overhead resistance. A strong close above $800 on renewed volume WOULD likely validate the broader bullish case initiated by the weekly breakout.
Momentum Indicators Signal Cooling Phase After Rally
The daily chart as of July 24 shows a sharp decline from $809.84 to $749.59, amounting to a 3.50% intraday loss. This correction, while notable, follows a parabolic uptrend that began in early July. Technically, this price action resembles a standard pullback after an extended rally. Unless it breaks below critical support near $740–$750, the broader trend remains intact.

Source: TradingView
Momentum indicators reflect this cooling phase. The MACD remains in bullish territory, with the MACD line at 28.90 still above the signal line, though histogram bars are beginning to flatten. The Chaikin Money FLOW (CMF) sits at 0.14, showing continued capital inflow but at a reduced rate compared to previous sessions.
A further dip below 0.10 on the CMF could suggest fading accumulation interest. For now, both indicators support a pause or consolidation, but not a reversal—positioning BNB for potential continuation if key support zones hold and buying activity resumes.
