Optimism (OP) Price Surge: Bulls Charge Toward $0.80 as EMA Support Holds Strong

Optimism's native token OP isn't just living up to its name—it's staging a textbook rebound from its EMA support line. Traders are now betting on a run toward $0.80, proving once again that crypto markets treat technical analysis like horoscopes for degens.
The EMA Bounce That Couldn't Be Ignored
When OP's price tapped the exponential moving average earlier this week, the reaction was instantaneous. Buy orders flooded in, creating the kind of price action that turns cautious investors into overnight meme-stock traders.
$0.80 or Bust: The Next Psychological Battleground
All eyes are now on that $0.80 level—a number significant enough to trigger FOMO, yet low enough that Wall Street analysts will still call it 'speculative garbage.' The chart pattern suggests momentum is building, but in crypto-land, 'suggests' is just a polite way of saying 'wild guess.'
Whether this rally has legs or just another pitstop before the usual crypto volatility kicks in remains to be seen. One thing's certain—when OP moves, it does so with the subtlety of a bull in a china shop.

After a prolonged bullish run earlier in July, the token is now testing key support NEAR its daily EMA ribbon—a zone that historically acts as a trend-defining level.
The latest technical structure suggests that while bears have gained control in the short term, bulls may still have a chance to reclaim momentum if the $0.70–$0.72 area holds. At the time of writing, OP is trading at $0.665, reflecting a 3.62% daily decline.
Technical Setup Shows Support Retest Following Sharp Rejection
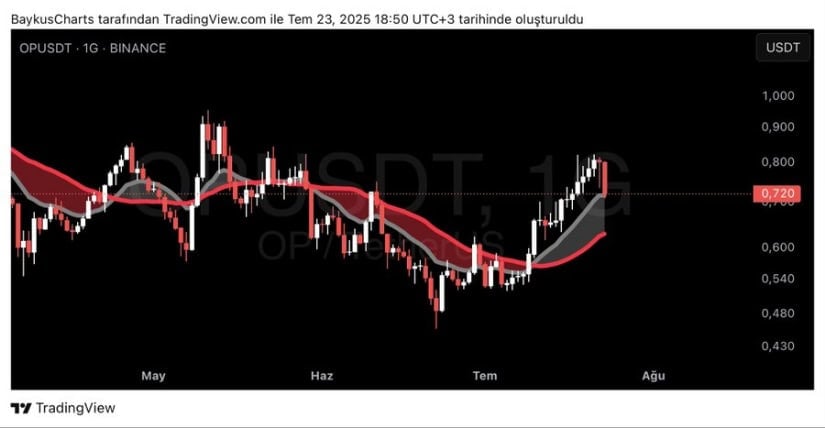
The daily OP/USDT chart shared by analyst Baykuş (@BaykusCharts) highlights a decisive rejection after Optimism touched the upper $0.80 resistance zone. Following the breakout above the dynamic EMA ribbon earlier this month, price action has returned to test the same zone as support.
This area—currently around $0.70–$0.72—coincides with the lower range of the EMA ribbon, which has served as a bounce zone during prior bullish phases.
Source: X
A notable feature in recent candles is the long upper wick, suggesting strong selling pressure above $0.78. The red and grey EMA ribbons continue to provide a structural framework for the trend, and the price resting on the ribbon’s green band reflects a high-stakes level for trend continuation.
A strong rebound here could confirm bullish resilience, but a daily close below $0.70 WOULD increase the probability of a bearish breakdown and reversion toward lower supports around $0.64 or $0.58.
24-Hour Price Movement Reflects Short-Term Weakness and High Volatility
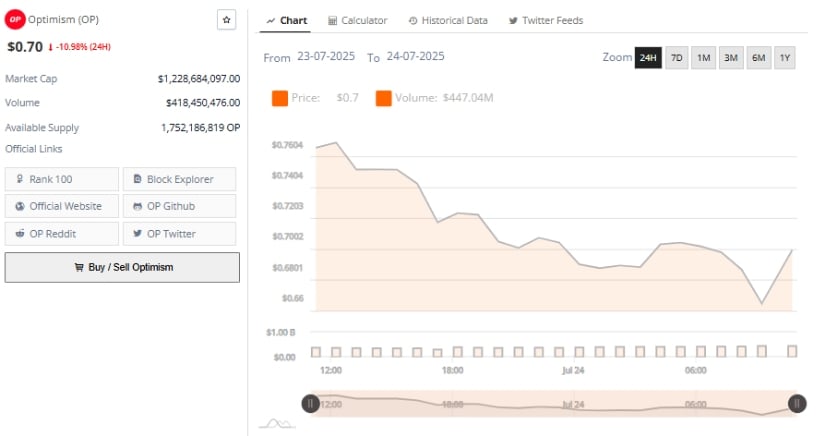
Over the past 24 hours, OP has experienced sharp declines with brief recovery attempts. The price dropped from a high near $0.76 to a low around $0.649 before bouncing back to $0.70, indicating heightened volatility.
This intraday structure featured lower highs and lower lows, pointing to sustained bearish pressure, likely fueled by broader market movements or negative sentiment tied to the token itself.
Source: BraveNewCoin
Trading volume during this session reached $447.04 million, higher than the recent average, suggesting significant participation in the downtrend. A large portion of this volume clustered around key breakdown points—particularly between $0.72 and $0.68—indicating a likely exit by short-term traders or larger holders.
While a small bounce occurred near session end, the strength of this MOVE remains uncertain. Traders will be watching to see if the price can sustain levels above $0.70 or if renewed sell pressure pushes the token back toward the $0.66 range.
Momentum Indicators at Crossroads as Bulls Attempt to Regain Control
On the daily timeframe, momentum indicators are showing mixed signals. The MACD (12,26) shows the MACD line (0.040) hovering just above the signal line (0.039), with the histogram narrowing to 0.001.
This convergence suggests the bullish momentum that propelled OP earlier this month may be waning. A bearish crossover in the coming days could confirm a reversal, increasing the risk of a further decline if support is breached.

Source: TradingView
The Chaikin Money FLOW (CMF) indicator remains in positive territory at 0.12, signaling that capital inflows continue to outweigh outflows. This divergence from the price decline suggests that some investors may be accumulating during the dip.
However, if CMF trends below the 0.10 level, it could indicate that broader selling pressure is taking hold. Holding above $0.70 remains critical for bulls aiming to reclaim the $0.80 resistance zone and reignite upward momentum.
steep pullback, momentum indicators, and volume data suggest a potential rebound is forming.
