Hedera (HBAR) Primed for $0.32 Breakout as Whale Activity and Bullish Momentum Surge

Whales are circling—and Hedera's price action just got interesting. The distributed ledger token shows all the signs of a classic accumulation phase, with big players quietly building positions ahead of what could be a decisive move.
Technical indicators flash green as HBAR tests key resistance levels. That $0.32 retest isn't just hopeful thinking—it's where the charts suggest we're headed next. Meanwhile, retail traders remain distracted by meme coin mania (classic).
Market depth reveals an asymmetric opportunity: limited sell walls above current price, but stacked buy support below. When this much smart money moves in one direction, it pays to watch where they're swimming.
Of course, in crypto-land, even 'sure things' can evaporate faster than a DeFi protocol's TVL after a hack. But for now? The whales are hungry—and HBAR's on the menu.

At the time of writing, HBAR is trading at $0.27163, reflecting a modest -1.33% pullback on the day. Despite short-term consolidation, capital inflows and momentum indicators point toward continued upward potential.
Whale Wallet Growth Signals Institutional Confidence
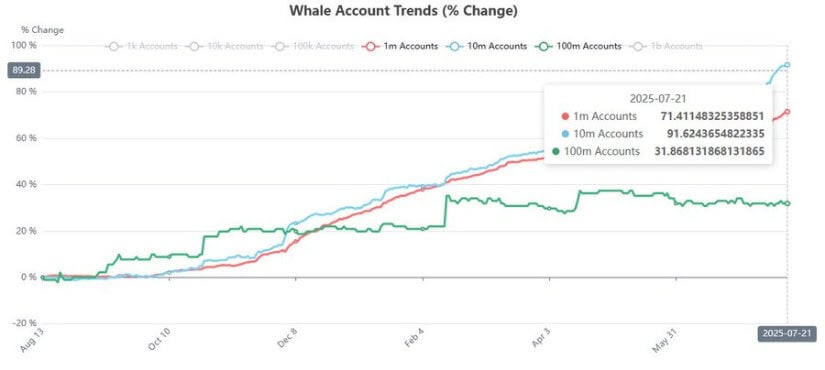
A recent wallet distribution chart shared by analyst @Steph_iscrypto shows a marked increase in medium to large wallet accumulation, with 10M HBAR addresses rising by 91.6% and 1M addresses growing by 71.4% since August 2024.
The largest wallet tier, 100M+ addresses, increased more moderately by 31.9%, indicating that newer or institutional-grade participants may be entering the market at this stage rather than earlier adopters. This trend suggests that “smart money” is positioning for a potential price expansion.
Source: X
The 10M wallet tier shows the strongest upward trajectory, gaining momentum particularly from March 2025. This sharp and consistent rise suggests long-term interest potentially driven by network developments, enterprise adoption, or protocol upgrades.
Combined with the mirrored growth in the 1M tier, the data reveals a broad-based confidence among mid-sized holders. Analysts often view this behavior as a leading indicator of price appreciation, given historical correlations between wallet accumulation and bullish breakouts in digital assets.
Market Activity Supports Ongoing Accumulation Phase
The 24-hour trading chart for HBAR reveals intraday volatility with a high of $0.2751 and a recovery from earlier losses. Despite a -0.67% daily dip, the session closed NEAR $0.27, showing that buyers are defending short-term support zones.
The volume profile reinforces this observation, with $640.21 million traded over 24 hours—a rise from earlier levels. Price movements aligned with volume spikes indicate active accumulation by market participants, particularly during brief corrections.

Source: BraveNewCoin
HBAR holds a market capitalization of $11.5 billion and ranks #19 among cryptocurrencies. With a circulating supply exceeding 42.3 billion tokens, large-cap investor behavior is critical for directional momentum.
The price consolidation between $0.265 and $0.280 appears to serve as a base for potential upward moves. If bulls maintain support at these levels and volume remains elevated, analysts expect a breakout toward the $0.30 region and beyond, contingent on broader market conditions.
Technical Indicators Maintain Bullish Outlook
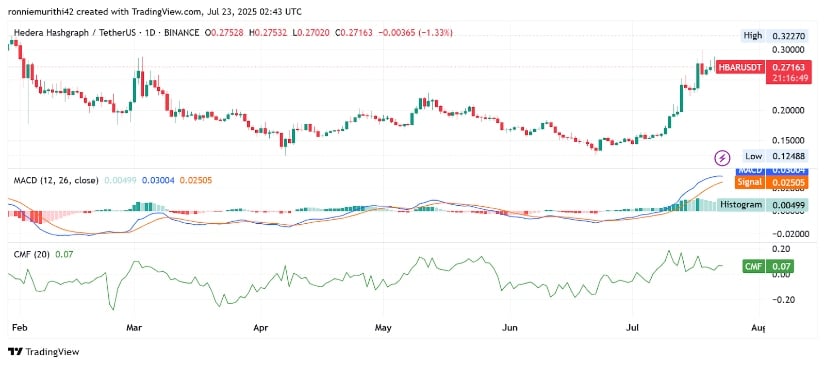
From a technical perspective, indicators continue to support a bullish bias. The MACD (12, 26) remains in positive territory, with the MACD line at 0.03004 trading above the signal line at 0.02505, while the histogram reads 0.00499.
Although the histogram bars are narrowing—suggesting momentum may be cooling—a crossover has not occurred. This suggests that the trend remains favorable in the short to mid-term unless indicators shift more significantly.
Source: TradingView
The Chaikin Money FLOW (CMF) stands at +0.07, indicating ongoing net capital inflow. While not as elevated as in peak accumulation phases, the CMF reading supports the case that institutional and large-scale buyers are still actively participating.
Should the CMF rise further, it could signal renewed momentum and trigger price exploration toward the previous high at $0.3227. Continued performance above $0.26 and confirmation of bullish volume trends may catalyze further gains as whale interest intensifies.
