Hedera Soars 80% Off Lows – Here’s Why the Rally Isn’t Done Yet

Hedera's native token just ripped past resistance—defying the crypto winter with an 80% surge from its recent lows. Traders are piling in as network activity spikes, but this isn't just a dead-cat bounce.
Why the momentum could keep going
Institutional adoption of Hedera's enterprise-grade DLT is accelerating (yes, even bankers love blockchain when it's this compliant). Meanwhile, retail FOMO is creeping back—because nothing fuels a rally like watching your neighbor's portfolio moon.
The cynical take? Every altcoin pumps until it doesn't. But with shorts getting squeezed and derivatives volume exploding, HBAR might just teach the 'buy high, sell low' crowd a painful lesson.

The token’s price action now suggests growing strength within a broader bullish structure. Several technical signals, ranging from intraday setups to longer-term indicators, point toward sustained upward momentum.
Analysts and data from multiple sources outline key levels that could define HBAR’s next movement phase.
Bullish Setup Emerges as HBAR Consolidates Above Support
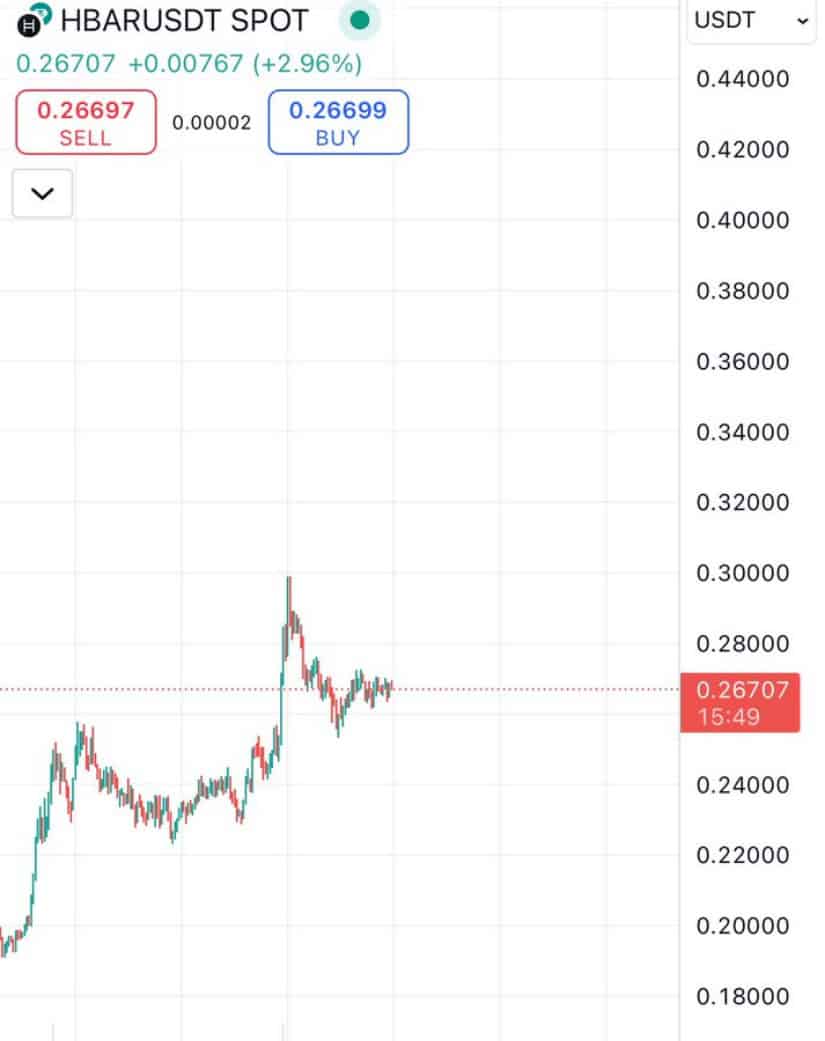
An analysis by @TheRealNaviNFT highlights a distinct bullish structure for HBAR/USDT, with the price currently trading at $0.26707 after gaining 2.96% in the most recent session. The chart displays a powerful impulse leg that began below $0.22 and reached over $0.31, followed by controlled profit-taking.
The resulting sideways consolidation reflects typical bullish continuation behavior, with resistance identified around the $0.31 level and strong support at $0.26.
Source: X
Within this consolidation, the price has settled into a narrow horizontal range. The formation resembles a bull flag or pennant patterns that often precede further upward movement. The initial surge saw rising volume, while the current low-volume consolidation supports the continuation pattern.
Additionally, the formation of higher lows suggests that buying interest is increasing as prices compress. If the price breaks above the $0.275–$0.280 range on rising volume, it could revisit the previous high of $0.31 and potentially extend toward $0.34 or even $0.40, based on measured technical projections. However, any slip below $0.255 could open a path toward $0.240.
HBAR Holds Gains as Data Reveals Supportive Momentum
Over the last 24 hours, Hedera has demonstrated price stability with a mild upward bias, currently trading at $0.27, representing a 1.89% increase. Price action during this period has demonstrated a consistent pattern of rallies followed by shallow pullbacks.
These short-term fluctuations have created a dynamic resistance at $0.270 while establishing a stable support band at $0.264, confirming intraday balance between buyers and sellers.
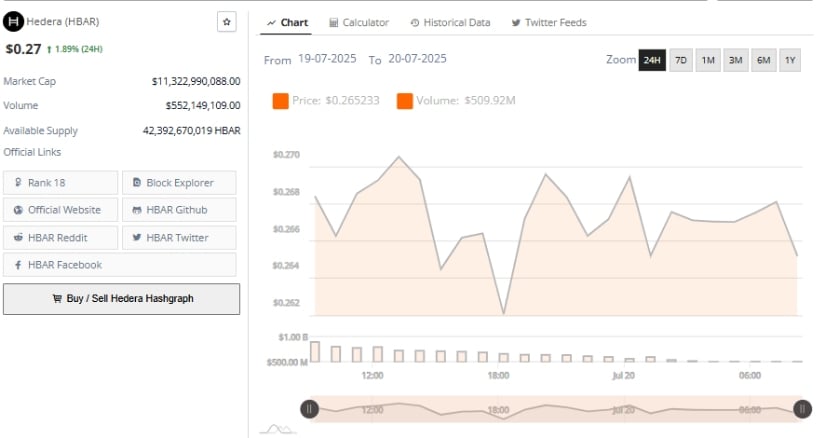
Source: BraveNewCoin
Volume over the same period reached $552.14 million, highlighting ongoing participation from both institutional players and short-term participants. The token’s price has remained confined within a horizontal channel, marked by a sequence of rising recoveries and shallow declines.
This pattern typically precedes directional movement, particularly when supported by sustained volume. HBAR’s market cap now stands at approximately $11.3 billion, placing it among the top 20 largest cryptocurrencies by market value. A decisive move past the $0.280 level WOULD likely shift focus toward the $0.30 zone, while the downside risk remains limited as long as support holds at $0.262.
Daily Bollinger Band Analysis Shows Strong Trend
As of the time of writing, Hedera is trading at $0.26750 on the daily chart, reflecting a 0.32% increase on the day. The token is hovering just below the upper Bollinger Band at $0.29115, indicating continued momentum after its prior gains.
The price remains firmly above the 20-day simple moving average (Basis line) at $0.20078, suggesting that the broader uptrend remains intact and supported by strong technical structure.
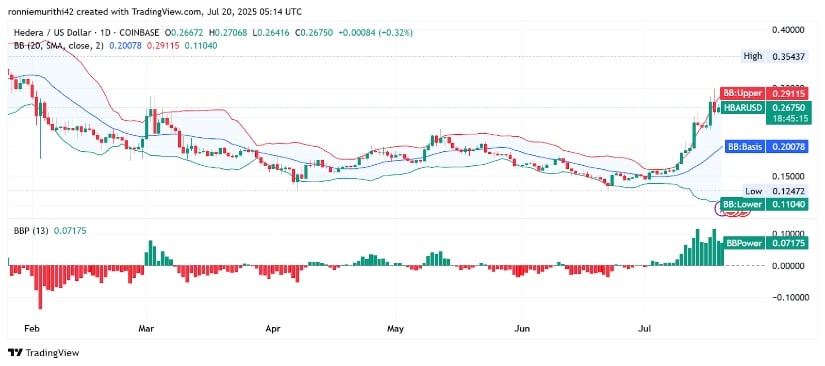
Source: TradingView
The Bollinger Band Power (BBP) indicator reads 0.07175, confirming a continued strength build-up since early July. The widening distance between the current price and the Basis line implies sustained volatility favoring the upside.
Bollinger Band expansion generally reflects directional momentum, and in this case, it confirms that HBAR is being accumulated during upward volatility phases. Immediate resistance stands between $0.291 and $0.300; any close above this range could push the price toward the yearly high at $0.35437. Key support levels include $0.260 for near-term structure and $0.20078 as a deeper base, maintaining a bullish overall outlook.
