Worldcoin at a Crossroads: Can It Hold $0.86 Support as Bearish Volume Looms?

Worldcoin's price teeters on the edge—testing a critical $0.86 support level while bearish trading volume signals trouble ahead.
Is this a temporary dip or the start of a deeper correction? The charts aren't lying: sellers are gaining momentum.
Meanwhile, crypto traders cling to hopium—because nothing says 'sound investment strategy' like ignoring volume trends. Stay sharp: this could get volatile.

The token briefly surged NEAR $0.89 before retracing toward the $0.86 zone, where buying activity has historically emerged. This drop occurred alongside a visible decline in momentum, putting pressure on the support band. With short-term technical setups signaling mixed sentiment, traders are closely watching for a decisive move above or below key levels.
Falling Wedge Breakout Offers Technical Upside Potential
According to analyst crypto Joe (@CryptoJoeReal), a falling wedge pattern recently emerged on the 30-minute chart of WLD/USDT. This setup formed during a downtrend as the price consolidated between two descending trendlines, eventually breaking out above the upper boundary. Wedge formations of this nature are often associated with bullish reversals, particularly when accompanied by rising volume at the breakout point.
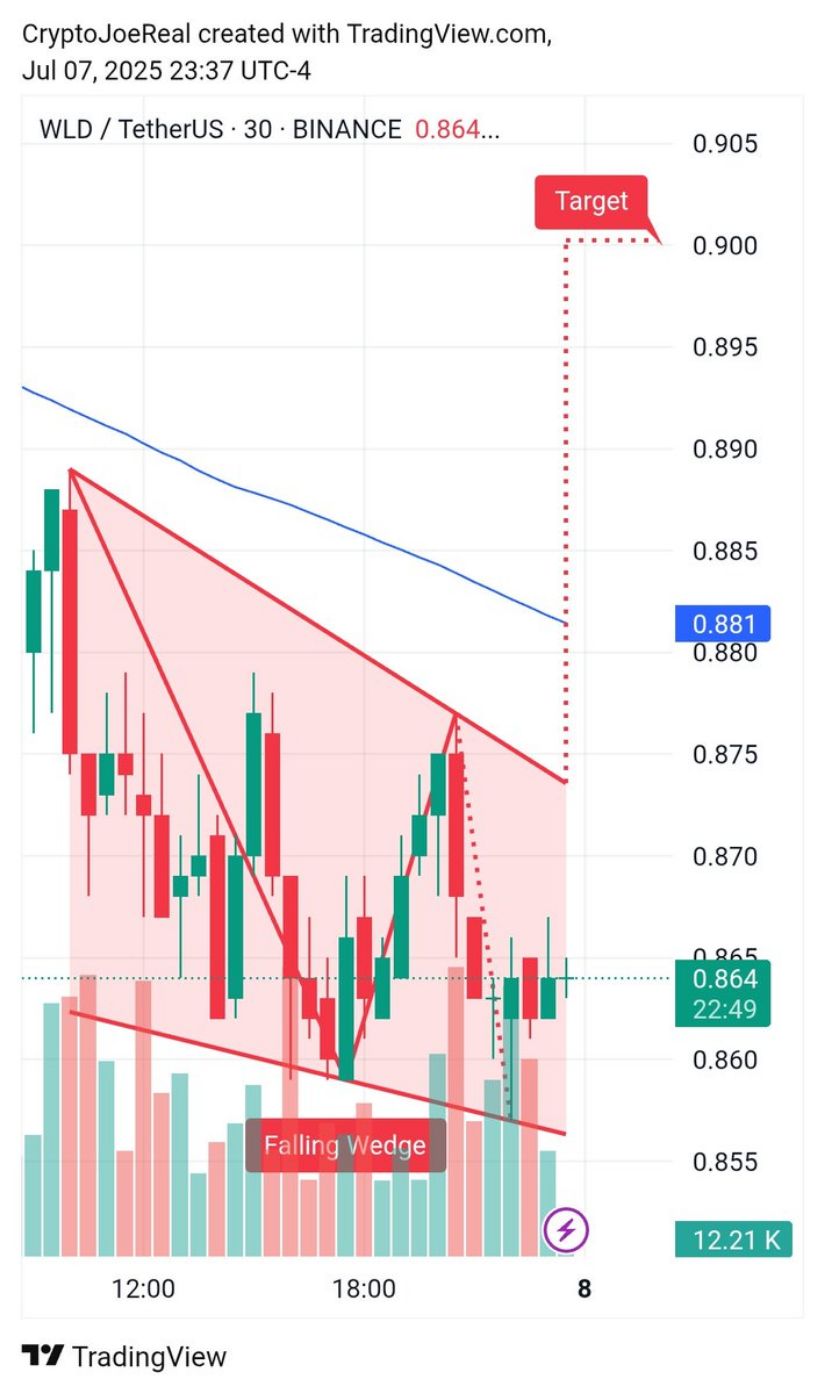
Source: Chart by Crypto Joe X
At the time of the analysis, WLD was trading near $0.864. Volume data during the breakout candle reflected a moderate increase in activity, suggesting buyer participation. The wedge’s measured MOVE projects a potential upside target around $0.90, representing a short-term resistance area.
This projection aligns with the height of the wedge pattern and provides a technical objective if the bullish structure holds. However, a key hurdle remains at the 200-period moving average, currently positioned around $0.881. If this level is cleared with confirmation from the volume, the breakout thesis will gain further credibility.
The structure remains valid if the price sustains above the former wedge resistance near $0.870. A failure to maintain this level could indicate a false breakout, potentially resulting in renewed selling pressure. As such, analysts emphasize the importance of sustained price closes above the moving average and steady volume follow-through to confirm any continuation.
Intraday Movement Highlights Resistance at $0.89
Recent price action over the past 24 hours shows Worldcoin experiencing a modest decline, with the token falling by 2.63% to $0.864. The price peaked early during the session, approaching $0.89, before gradually retreating. A series of lower highs followed the initial peak, suggesting short-term bearish sentiment. Although there were attempts to stabilize, sellers maintained pressure throughout the trading window.
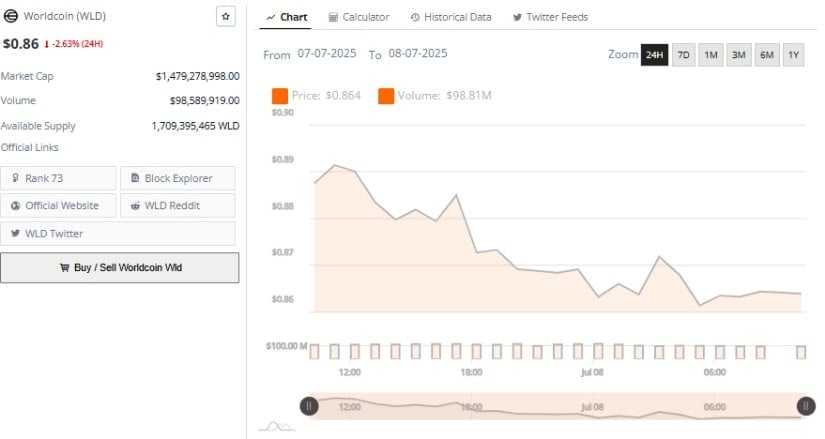
Source: Chart by BraveNewCoin
The trading volume during this period reached approximately $98.81 million, indicating moderate participation. While not exceptionally high, this figure reflects consistent activity rather than a major liquidation event. The steady decline in volume in the latter half of the session suggests market indecision rather than aggressive selling.
This volume tapering could indicate consolidation near current levels, especially if support holds above $0.86. A breakdown below this threshold, however, may expose WLD to additional losses toward the $0.84–$0.82 area.
Worldcoin’s current market capitalization stands at approximately $1.47 billion, placing it among mid-cap digital assets. With a circulating supply of over 1.7 billion WLD, the token has enough liquidity to support volatile price shifts. The relatively stable volume pattern implies that institutional-level sell-offs are unlikely at this stage, though price remains sensitive to short-term sentiment shifts.
Technical Indicators Suggest Limited Immediate Rebound
The daily chart for WLD/USDT shows a continued downward trend, with the price currently at $0.860, reflecting a 1.38% drop in the last session. Candlestick activity suggests low volatility and limited buying interest, with price movements tightly bound between $0.857 and $0.877 in recent sessions.
This consolidation range points to indecision in the market and follows an extended decline from highs observed in May. Worldcoin remains significantly below its all-time peak of $2.468, reinforcing the broader bearish context.
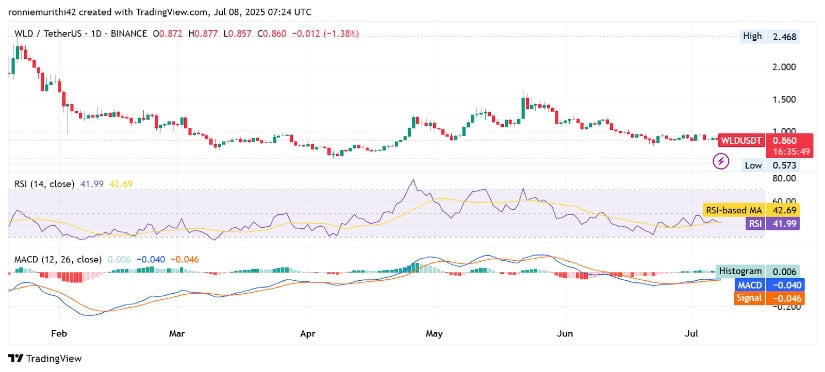
Source: Chart by TradingView
Momentum indicators paint a subdued technical picture. The Relative Strength Index (RSI) reads 41.99, with the RSI-based moving average slightly higher at 42.69. These figures underscore ongoing bearish momentum, as the RSI has struggled to surpass the neutral 50 threshold since mid-June. A movement above 60 WOULD be required to shift the current outlook toward a more bullish scenario, though such a breakout remains elusive at this stage.
The MACD presents a slightly more optimistic signal. The MACD line sits just above the signal line, at -0.040 versus -0.046, with a positive histogram value of 0.006. This indicates a potential bullish crossover may be forming, although momentum remains weak.
A more decisive move would require a clear push above key resistance near $0.90 and should be supported by a significant uptick in trading volume to establish confidence in any trend reversal. Until such confirmation emerges, WLD is likely to remain in a subdued trading range.
