SEI Price Alert: Traders Watch for Short Signals as SEI Plunges Under $0.26

SEI takes a nosedive—dropping below the $0.26 threshold as traders sharpen their knives for a potential short play. Here’s the breakdown.
### The Bearish Setup Unfolds
SEI’s latest dip isn’t just a blip—it’s a flashing neon sign for traders eyeing downside momentum. With the price now teetering below $0.26, the market’s itching for confirmation of a short setup. No surprises here—crypto moves fast, and sentiment flips faster than a Wall Street analyst changing their 'long-term outlook.'
### Why This Level Matters
$0.26 isn’t just another number. Break below it, and SEI could be staring at a freefall. Hold above? Bulls might claw back some dignity. Either way, traders are glued to their screens, waiting for the next domino to drop.
### The Bigger Picture
Crypto’s a casino, and right now, SEI’s rolling the dice. Will the shorts clean up, or is this just another fakeout before the next pump? Only time will tell—but one thing’s certain: in this market, 'fundamentals' are just something to ignore between leverage trades.

The asset, which had shown strength late last month, is now experiencing selling pressure across both spot and derivative markets.
With volume patterns favoring sellers and technical indicators flashing caution, traders are watching closely for confirmation of a short bias. Whether SEI can hold above near-term support could determine its next direction.
Bearish Continuation Signals Appear Across Derivative Metrics
The 1-hour SEI/USD chart from Open Interest presents a sequence of lower highs and lower lows, confirming a gradual short-term downtrend. The current price stands at $0.2499, reflecting a marginal 0.32% recovery, though the broader market structure continues to favor bears.
Since July 6, SEI has faced consistent rejection NEAR the $0.2650–$0.2700 range. Even brief rallies toward these levels have met with swift selling, indicating active resistance zones. Recent candles show limited follow-through, hinting at weakening bullish attempts.
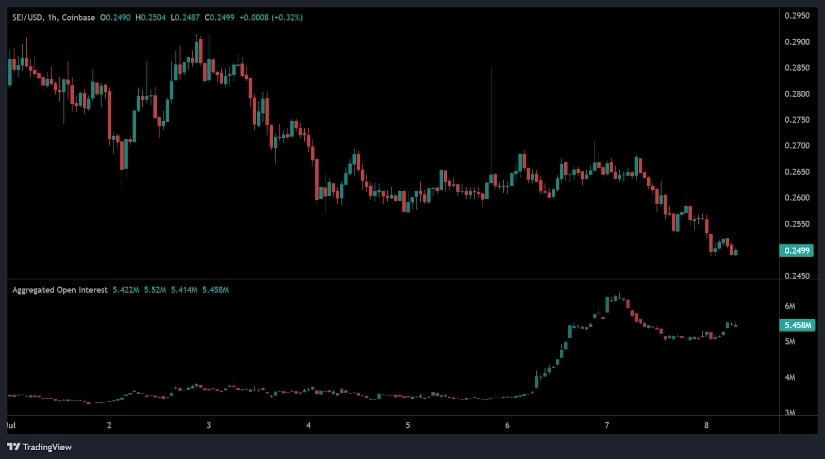
Source: Chart by Open Interest
Beneath the price chart, aggregated open interest data provides additional context. Open interest surged between July 6 and early July 7, peaking just above 6 million contracts before retreating to approximately 5.458 million.
This initial spike coincided with a price rally but was followed by a pullback, suggesting potential long liquidations and reduced conviction among bulls. The flattening of open interest amidst falling price action reflects a cautious trading environment, with traders awaiting a clearer directional catalyst.
The current setup signals fragility in momentum. If open interest begins to rise again without a breakout above $0.2550, it could signal renewed short positioning. Alternatively, if the price regains the $0.2600 zone with supportive volume, a short squeeze could materialize. Until either scenario plays out, Sei remains confined in a low-volatility range.
Intraday Losses Mount as Downtrend Pressures Support Zones
Over the last 24 hours, SEI recorded a 5.20% decline, falling from $0.265 to $0.25. The token continued its downward trajectory throughout July 7 and into July 8, establishing a fresh lower range. Intraday price movement demonstrated a consistent slide, with no significant reversal patterns emerging. The narrow range between $0.245 and $0.265 highlights a controlled downtrend, underscoring bearish sentiment in the short term.
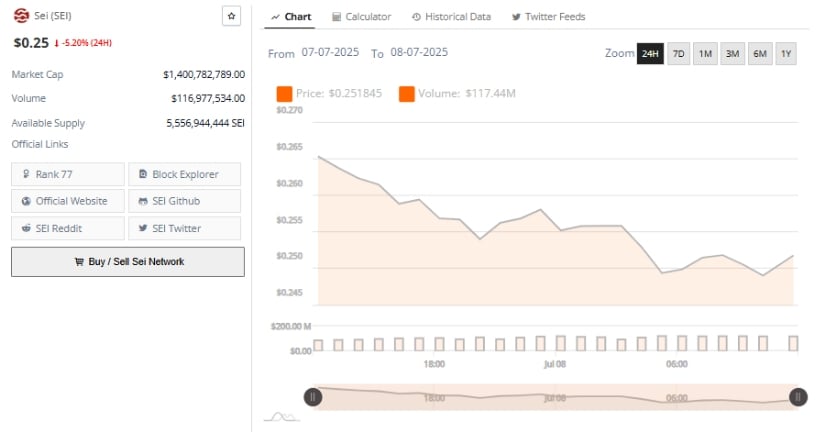
Source: Chart by Brave New Coin
SEI’s 24-hour trading volume reached $117.44 million, suggesting sustained participation even amid price declines. This volume profile, paired with falling prices, points toward active selling rather than passive market behavior.
Despite no sharp spikes in volume to indicate panic selling, the steady trade activity aligns with gradual distribution. Current market capitalization is $1.4 billion, positioning SEI at #77 among cryptocurrencies by market cap, with a circulating supply of 5.55 billion tokens.
Technical traders are now monitoring the $0.245 area, which has served as an intraday floor. If this level fails, the next likely downside target may emerge around $0.230, barring a sudden reversal. Without a meaningful shift in demand or momentum indicators, downside risk remains elevated.
Technical Indicators Point to Weakening Momentum
As of July 8, 2025, SEI/USDT is trading at $0.2515, registering a 1.72% intraday drop. The daily chart illustrates a continued retracement from late June highs, where the asset briefly surpassed $0.30. Successive red candles confirm a lack of bullish follow-through, with the token now approaching its short-term support band near $0.245. While still above multi-month lows, SEI remains under visible bearish pressure.
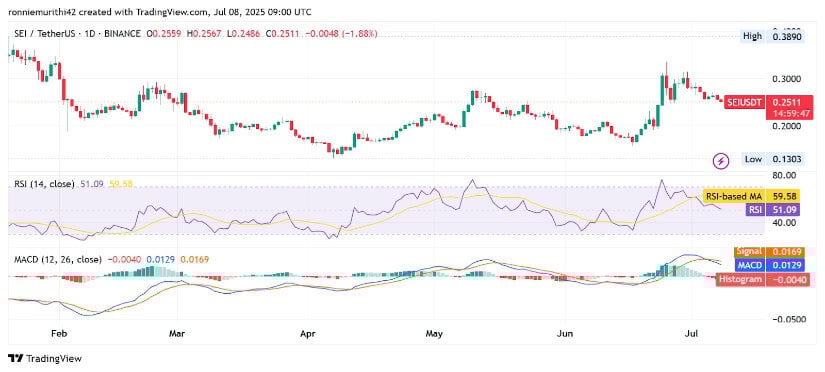
Source: Chart by TradingView
The Relative Strength Index (RSI) currently reads 51.22, marginally above the neutral 50 but trending lower. The RSI’s position below its moving average of 59.59 suggests waning upward momentum. Since peaking alongside price in late June, the indicator has gradually declined, aligning with broader price trends.
The MACD (Moving Average Convergence Divergence) also reflects fading strength. The MACD line at 0.0129 sits just below the signal line at 0.0169, with the histogram turning negative at -0.0040. This potential crossover reinforces the possibility of a bearish reversal unless upward momentum reappears. Without a surge in volume or technical divergence, traders are likely to continue favoring downside positioning in the near term.
