Worldcoin Price Prediction: Bulls Hold Strong at $0.87 Despite Sharp Rejection—What’s Next?

Worldcoin's bulls dig trenches at $0.87—can they turn the tide?
After a brutal rejection, WLD traders brace for the next move. The $0.87 level has become the crypto's Alamo—where bulls either mount a comeback or face another leg down.
The Battle Lines
No fancy indicators needed here. Price either holds this zone—or gets dragged back into the abyss. Market makers love these knife-edge scenarios; retail traders? Not so much.
The Bigger Picture
If the support crumbles, we're staring at a 20% drop to the next liquidity pocket. Hold above? A retest of $1.20 isn’t off the table—assuming the bulls don’t get distracted by the next shiny DeFi project.
Bottom Line
Worldcoin’s price action screams 'trapped liquidity.' Whether that’s a springboard or a trapdoor depends entirely on whether bulls can outlast the whales. And let’s be real—when was the last time retail won that fight?

The token is now holding support at $0.87, a key zone that buyers are attempting to defend amid shifting derivatives activity and broader market recalibration. Despite some volatility, accumulation signs have emerged across intraday and daily charts, suggesting a possible setup for the next move.
Open Interest Declines as Price Retraces From $0.985
The 1-hour chart from Open Interest highlights notable short-term volatility in Worldcoin’s recent price structure. Between June 27 and July 1, WLD traded sideways NEAR $0.86 before rallying to a high of $0.985 on July 3. However, that breakout failed to hold, leading to a quick retracement to $0.929. The rejection occurred near the psychologically important $1 level, indicating that sellers regained control at that resistance.
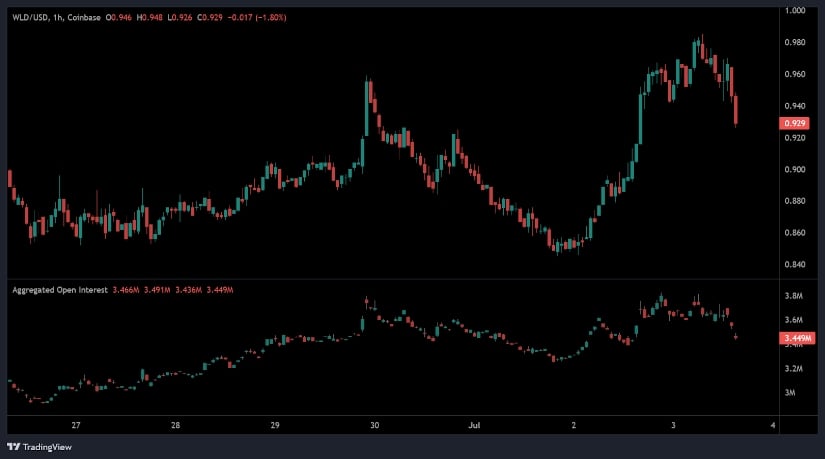
Source: Open Interest
Simultaneously, aggregated open interest ROSE during the upward move, signaling that traders were opening long positions in anticipation of a continued breakout. However, once the rally stalled and prices reversed, open interest also began to decline, falling to approximately 3.449 million.
This shift in OI suggests that traders exited their positions—either through liquidation or risk management—pointing to decreased speculative conviction in the short term. The combination of falling price and declining OI signals a de-risking phase rather than immediate bullish continuation.
Chart Shows Broad Participation in Uptrend
In the 24-hour BraveNewCoin chart from July 2 to July 3, Worldcoin showed a more positive trend, with the price climbing steadily from around $0.91 to $0.981. The session closed with an 11.39% gain, supported by a 24-hour trading volume of $254.58 million. This gradual and steady price increase occurred without dramatic volume spikes, indicating consistent buying across the market rather than isolated activity.
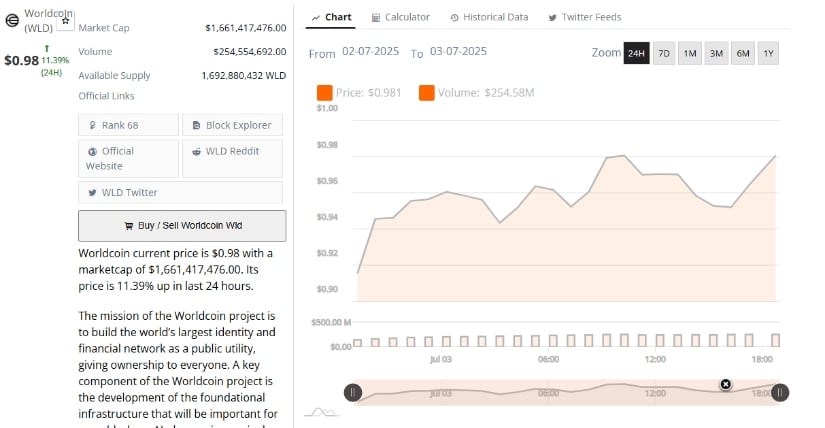
Source: Brave New Coin
The volume pattern remained flat yet sustained, suggesting broad participation during the rally. Unlike isolated short squeezes, this type of volume profile often reflects accumulation rather than short-term speculation. Worldcoin’s market capitalization rose to over $1.66 billion during this period, reinforcing its mid-cap position in the crypto sector.
Additionally, the circulating supply stood at 1.692 billion WLD, with the token ranked 68 overall. This upward price movement, coupled with stable volume and market cap data, points to a measured interest from buyers, though not enough yet to clear the $1 resistance.
If WLD continues to trade within the $0.95–$0.98 range, a daily close above $1 could validate a bullish breakout attempt. However, sustained failure to surpass that level may result in renewed selling pressure, especially if broader market conditions remain uncertain.
TradingView Daily Chart Signals Consolidation Range
The TradingView daily chart for WLD/USDT on TradingView provides a longer-term context showing the full cycle from the April breakout to the current consolidation. From mid-April to early May, the token surged from under $0.60 to above $1.60, but this MOVE was followed by sustained profit-taking. The rejection at the top formed a long upper wick, and the token began a steady downward trend, forming a clear sequence of lower highs and lower lows.
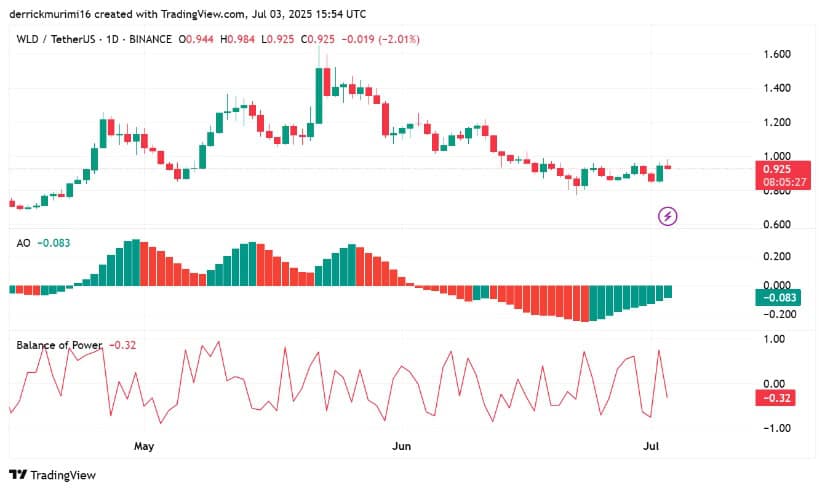
Source: TradingView
Currently, Worldcoin is trading within a narrow range between $0.85 and $0.95. The price as of July 3 is $0.930, down 1.48% on the day, but holding within the horizontal consolidation zone. The relative balance of green and red daily candles over the past week suggests indecision, as neither bulls nor bears have taken control.
Although indicators like the Awesome Oscillator and Balance of Power are still loading, the price structure itself outlines two critical levels: resistance at $0.98 and support at $0.87. A daily close above the resistance could open a path toward $1.20, while a drop below $0.87 may expose WLD to further downside.
