Hedera Price Surge Ahead? Key Technical Indicators Flash Buy at $0.13842

Bulls are circling as Hedera's charts scream opportunity. The $0.13842 support level isn't just holding—it's becoming a launchpad.
Technical breakdown: Every oscillator from RSI to MACD lines up like runway lights. This isn't hopium—it's math. Even the most cynical traders know these patterns precede moves.
Market context: While traditional finance plays with 0.5% bond yields (how quaint), Hedera's network growth and enterprise adoption tell a different story. The smart money's already positioning.
Risk warning: Crypto doesn't do 'sure things.' But when this many signals align, even Wall Street dinosaurs take notice—usually right before they miss the boat.

This gradual recovery aligns with expectations of a short-term base forming, supported by consistent volume and indicator behavior. If momentum continues to build, the price may approach higher resistance levels in the NEAR term.
Market Analyst Identifies Support Range and Recovery Targets
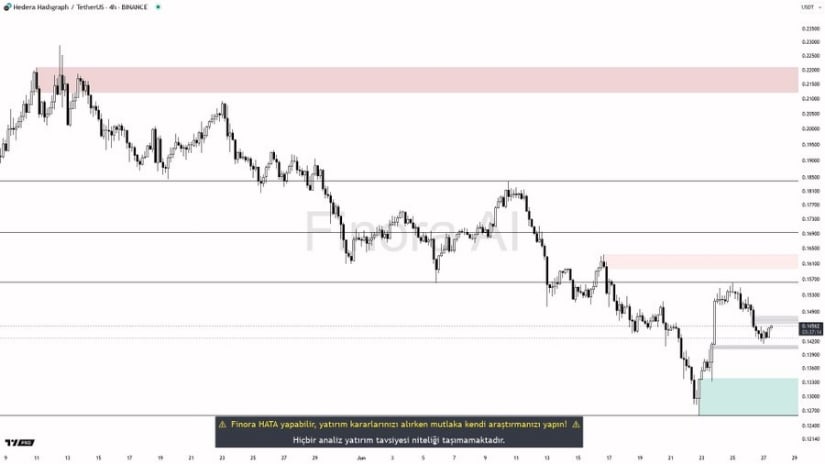
In a recent market post, a crypto analyst Finora outlined a price structure for HBAR/USDT, highlighting a key support range between USDT 0.14300 and 0.13842. The 4-hour chart showed that after a steep decline, the token is attempting to recover, currently stabilizing above the USDT 0.14400 zone.
The analyst emphasized the importance of this area as a foundation for potential upward movement. If confirmation appears through a reversal candle or a liquidity sweep within the zone, price targets have been set at USDT 0.15649 and USDT 0.16335.
Source: X
The analysis also considered a scenario where the price falls below USDT 0.13842 but displays a strong reaction from buyers. In such a case, entering a long position could remain viable. However, if the price closes below this level without recovery, the bullish outlook WOULD be considered invalid.
The approach to risk management avoids a fixed stop-loss, instead focusing on observing price structure around the most recent swing low. This framework reflects cautious Optimism based on structural support and accumulation potential in this critical range.
Volume Activity and Price Movement Indicate Accumulation
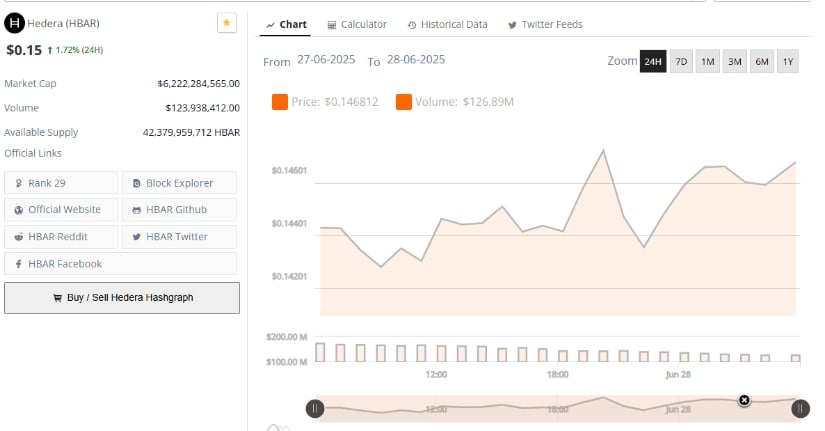
Over the past 24 hours, Hedera price prediction has shown a 1.72% increase, reaching approximately USDT 0.15. Market data tracking recent activity shows a steady uptrend beginning on June 27, marked by higher lows and a consistent pattern of intermittent upward peaks.
The price opened at USDT 0.146812 and gradually climbed, signaling early signs of demand returning after a prolonged decline. The movement was not accompanied by volatility spikes, suggesting that the rise may be based on steady accumulation rather than speculative activity.
Source: Brave New Coin
The trading volume during this period stood at USDT 126.89 million, while market capitalization reached USDT 6.22 billion, positioning HBAR at rank 29 among digital assets by market value. The available supply remained stable at just over 42.3 billion tokens, with no unusual inflows observed.
Volume behavior appeared consistent throughout the 24 hours, lacking abnormal surges, which may reflect strategic positioning by holders. These metrics support the view that the asset is building a short-term base, with conditions aligning for a possible continuation of the upward trend if momentum persists.
Indicators Reflect Momentum Shift and Reduced Selling Pressure
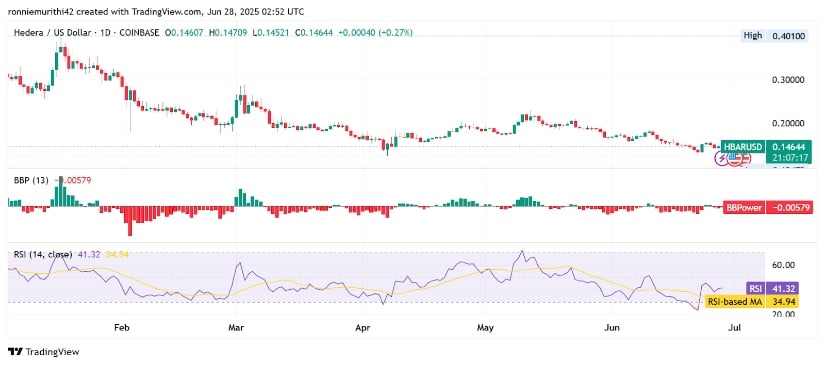
Additionally, the daily chart for HBAR/USD price prediction continues to reflect the broader downtrend, with price action remaining within a lower range. However, recent candles show signs of stabilization near USDT 0.14677, supported by tighter trading ranges and a small green recovery candle marking a 0.50% gain.
Despite this move, HBAR has yet to reclaim resistance zones above USDT 0.16, suggesting that the current recovery remains in its early stages. Price would need to break above these key levels to confirm a change in direction.
Source: TradingView
The Bollinger Band Power (BBPower) indicator remains in negative territory at -0.00589, signaling lingering bearish momentum. However, the declining size of red bars suggests reduced selling intensity. While this is not yet a bullish reading, it may indicate the initial phase of momentum stabilization.
Meanwhile, the Relative Strength Index (RSI) is currently at 41.62, having crossed above its moving average at 34.96. This crossover points to weakening downside momentum and may serve as a precursor to renewed strength if RSI crosses the neutral 50 mark. Current signals are neutral to slightly positive, pointing toward cautious recovery rather than full reversal. Market direction in the coming sessions will depend on how HBAR reacts to near-term resistance.
