BNB Bulls Charge Ahead: Binance Coin Gains 0.13% as Momentum Builds

Binance Coin (BNB) flexes its muscles with another green day—up 0.13% as traders bet on bullish continuation. The exchange-backed asset defies crypto winter whispers, inching toward potential breakout territory.
Why it matters: While traditional markets wrestle with inflation and rate hikes, BNB’s micro-gain signals resilience—or just another day in the casino-like crypto markets where 0.13% counts as 'momentum.'
Zoom out: Binance’s native token continues to benefit from ecosystem growth, even as regulators circle. Forget 'safe haven'—this is a high-stakes game where even fractional gains get headlines.

Binance Coin (BNB) Price Prediction is showing early signs of bullish momentum, with the price now hovering around USDT 644.55, a modest 0.13% increase over the last 24 hours. Ranked fifth among global digital assets, BNB’s current market capitalization exceeds USDT 94 billion, supported by a daily trading volume of USDT 482.8 million.
Stable Demand and Investor Sentiment Support Positive Outlook
Data from Brave New Coin platforms reflects that BNB price remains a high-utility token, deeply integrated into its parent exchange’s ecosystem. Having launched in 2017 as an ERC-20 token before migrating to its chain, BNB offers fee reductions for trading and transactions.
Over the years, these incentives have encouraged long-term holding behavior. Additionally, the implementation of a quarterly burn mechanism contributes to a deflationary supply model, reinforcing BNB’s long-term value.Source: X
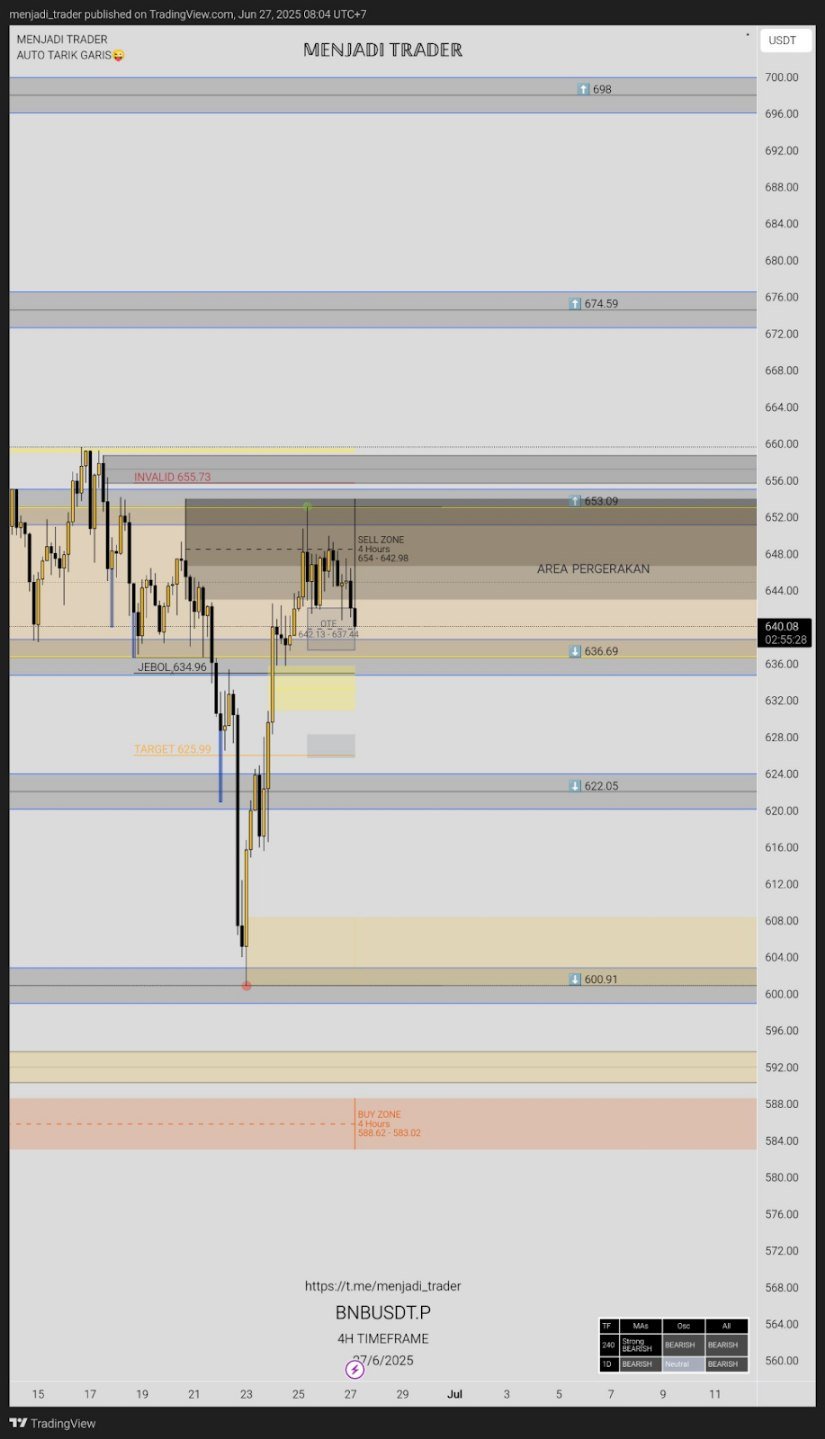
Analysts Menjadi Trader monitoring market trends note that BNB’s continued performance, even amid market volatility, underlines investor confidence. The token’s ability to hold above key levels while maintaining strong market cap rankings is seen as evidence of stable demand.
Chart patterns show a controlled trading environment, with price behavior suggesting accumulation. According to industry assessments, the current conditions may set the stage for further appreciation if macro trends remain favorable.
Chart Patterns Show Consolidation as Activity Rebuilds
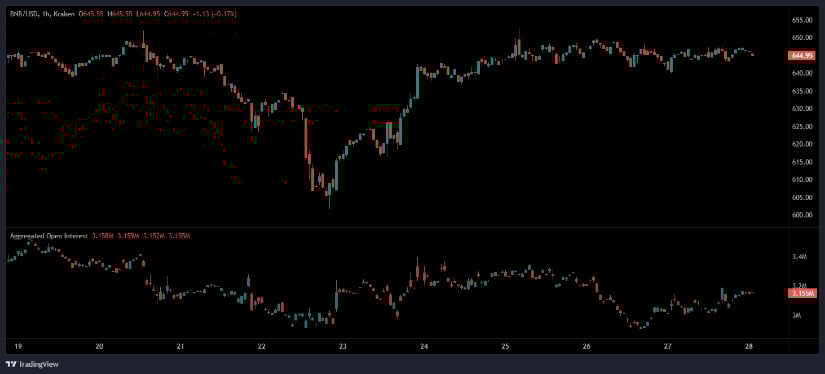
Short-term technical analysis on the 1-hour chart shows that BNB recently rebounded from lows NEAR USDT 605, climbing steadily back into a consolidation range between USDT 640 and USDT 650. This movement followed a brief period of sharp selling pressure around June 22, which was quickly met by an intraday recovery.
Since then, the price has stabilized within this narrow band, marked by smaller candles and decreased volatility. This behavior points to a temporary pause in momentum as market participants assess upcoming directions.
Source: Open Interest
At the same time, aggregated market behavior indicates that active participation dipped sharply during the sell-off but has gradually started to return. A measured increase in participation over recent hours suggests that traders are cautiously re-entering the market, but without significant risk exposure.
The flat nature of this participation aligns with the horizontal trading pattern, signaling a state of neutrality where neither upward nor downward pressure dominates. The next significant MOVE will likely depend on a confirmed breakout from the current range.
If BNB can push above USDT 655, supported by increased volume and continued engagement, a continuation of the upward trend becomes more probable. Conversely, if the asset falls below USDT 640, it may indicate weakening buyer interest. The current setup reflects a market in balance, where decisive movement in either direction will set the tone for the days ahead.
Binance Coin Price Prediction: Indicators Reflect Early Bullish Momentum
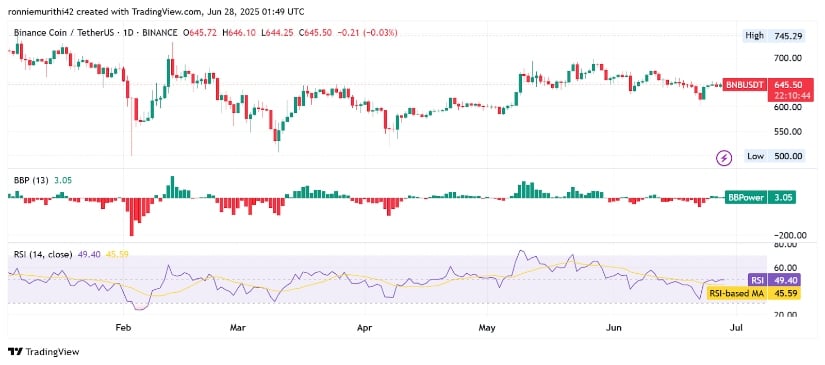
On the daily chart, BNB’s Price Prediction recent performance shows a controlled environment with cautious upward pressure. After failing to maintain levels above USDT 700, the price has retraced to its current zone.
The local high near USDT 745.29 serves as an upper reference, while strong psychological support holds near USDT 600, and firmer backing appears at USDT 500. The current sideways structure within a descending channel highlights the subdued momentum, though recent candlesticks suggest price compression and indecision.
Source: TradingView
One notable development is the upward shift in the Bollinger Band Power (BBPower) indicator, now reading 3.05, signaling early bullish bias after several negative sessions. While this is not yet conclusive, it reflects the market’s gradual shift away from bearish control. The indicator has remained close to neutral for much of June, reinforcing the view of a market awaiting direction.
The Relative Strength Index (RSI) stands at 49.40, with its moving average at 45.59, both hovering in the neutral zone. The recent crossover above the moving average could signal the beginning of positive momentum, although confirmation is still pending.
Market participants will likely watch for a sustained move above the 50-level on the RSI, which often marks a shift toward bullish territory. The alignment of technical indicators with stable price action supports the case for potential upward continuation if resistance levels are breached.
