Optimism Price Poised for Breakout: Bullish Signals Flash as $2 USDT Target Comes Into Focus

Optimism (OP) is flashing its most bullish technical setup in months—and traders are lining up for a potential run at $2 USDT.
The Pattern That Has Traders Talking
A textbook ascending triangle on the daily chart suggests accumulation, with each higher low building pressure for an explosive upside move. The $2 target isn’t just aspirational—it’s mathematically derived from the pattern’s height.
Market Sentiment Shifts Gears
Futures open interest just hit a 3-month high, while funding rates remain neutral. That rare combo signals speculators are positioning for upside without the usual overleveraged frenzy (yet).
The Cynic’s Corner
Of course, this could all be another ‘buy the rumor, sell the news’ play—because nothing moves markets like traders front-running their own hype.

The market continues to evaluate whether this LAYER 2 solution is poised for a breakout or another phase of consolidation. As the token trades below the $0.55 mark, analysts are closely watching for technical confirmation of a move toward the $2.00 range.
Analyst X Highlights Wedge Formation and Price Setup
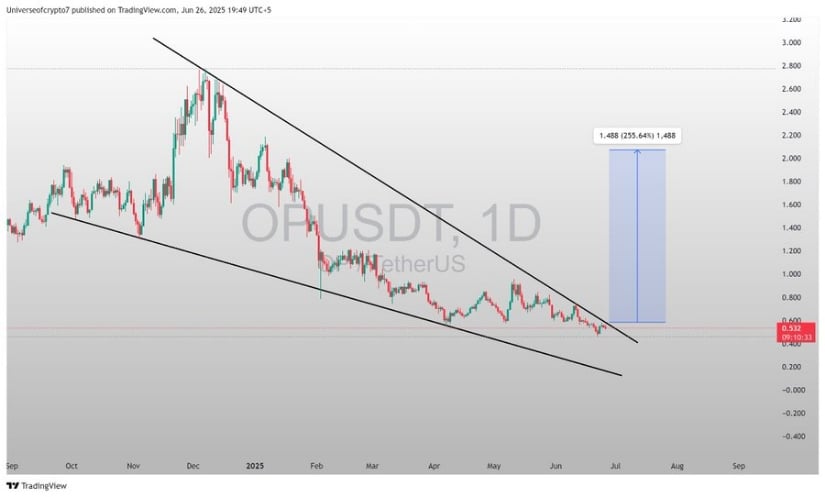
In a recent update shared via X, analyst Universe of crypto noted that OP/USDT price is nearing the end of a falling wedge pattern, a setup often associated with bullish reversals. The pattern has developed since December 2024, marked by declining highs and lows that have narrowed within two downward-sloping trendlines.
With the price now nearing the wedge’s resistance boundary, technical expectations point to a possible breakout scenario. The chart shared by the analyst projects a potential price target of 1.488 USDT if the breakout occurs, representing a 255% increase from the current levels.
Source: X
The analyst further described OP as “the most undervalued Layer 2 project,” pointing to low market sentiment and reduced interest from buyers despite its fundamentals. According to the chart structure, the projected target is based on the height of the wedge, a traditional technical measurement in breakout forecasting.
The success of this potential MOVE hinges on a confirmed breakout above the upper trendline, followed by a retest and validation of support. Without this confirmation, the price could remain trapped within the wedge or trend downward toward previous support zones.
Optimism Price Prediction: Brave New Coin Data Reveals Market Caution
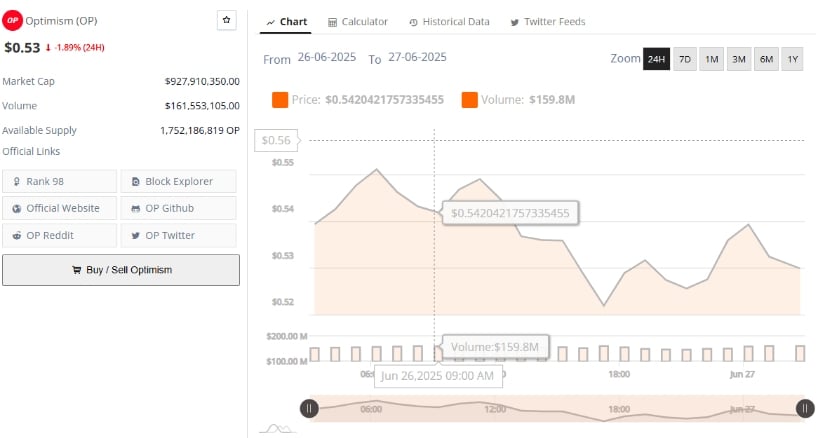
On the other hand, data from Brave New Coin covering the 24-hour trading period from June 26 to June 27 indicates modest bearish pressure, with Optimism trading at approximately $0.53, reflecting a 1.89% decline.
Price action throughout the day saw the token fluctuate between $0.520 and $0.559, with a peak around $0.542 occurring mid-morning. Despite a temporary increase in value, the asset failed to hold gains above the $0.55 threshold, suggesting limited buying strength and hesitation among participants.
Source: Brave New Coin
Trading volume for the period was recorded at approximately $161.5 million, with a significant volume spike of $159.8 million registered around 09:00 AM UTC. This increase in activity corresponded with the brief upward price movement, hinting at short-term speculative interest.
However, the lack of sustained upward momentum following this volume spike indicated profit-taking or cautious positioning, which contributed to the decline back into the $0.53 range. The market cap of Optimism currently stands at $927.9 million, with an available supply of 1.75 billion OP tokens, placing the asset at rank 98 among global digital assets.
Overall, Brave New Coin’s data reflects a state of indecision, where short bursts of trading activity are not yet strong enough to drive a trend reversal. Without a definitive push above key resistance levels, the asset remains vulnerable to sideways price action or further pullbacks.
TradingView Indicators Point to Neutral Momentum
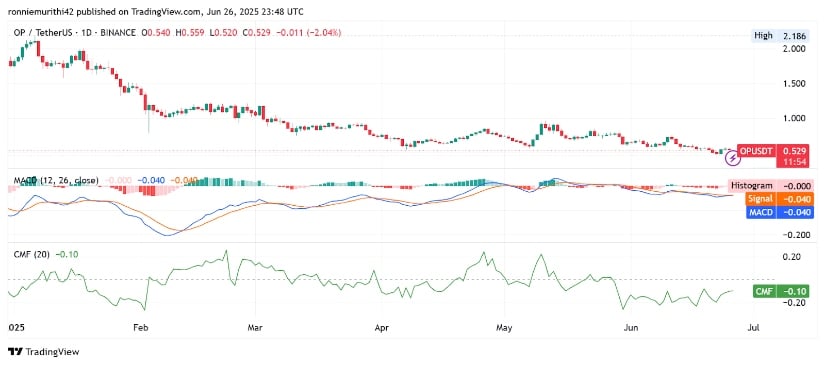
Additionally, the daily chart from TradingView for OP/USDT Price Prediction also reinforces the ongoing uncertainty, with the token trading at $0.529 at the time of analysis. The candlestick pattern continues to display a downtrend from the yearly high of $2.186, with no clear signs of a reversal in place.
The market remains in a consolidation phase NEAR the lower bounds of the trend, which could either lead to a breakout if buying resumes or deepen into another leg down if support fails to hold.
Source: TradingView
Technical indicators on the chart present a mixed outlook. The MACD (Moving Average Convergence Divergence) is neutral, with both the MACD line and signal line positioned at -0.040. The histogram remains flat, indicating a lack of momentum and minimal volatility in the current price zone. This setup typically precedes a significant price move, but the direction remains uncertain until a crossover or divergence occurs.
Additionally, the Chaikin Money FLOW (CMF) reading is at -0.10, indicating weak capital inflows and suggesting that sellers still dominate the market. A CMF value below zero usually reflects bearish pressure, with large holders showing limited interest in accumulating.
Until the CMF returns to positive territory and the MACD begins to rise, technical confidence in an upward breakout remains low. These conditions underline the importance of closely monitoring volume, price structure, and indicator alignment in the coming sessions.
As optimism price prediction approaches a key technical zone, traders and holders are watching for signs of validation that could confirm a breakout toward 1.488 USDT and beyond. With momentum indicators still mixed, market participants remain cautious while preparing for a potentially volatile shift in OP’s short-term direction.
