HBAR Price Prediction: Will $0.1305 Support Hold or Fold?

All eyes are on the $0.1305 line. It's not just a number—it's the battleground where Hedera's HBAR token either finds its footing or triggers the next wave of sell-offs.
The Technical Tug-of-War
Support levels in crypto aren't gentle suggestions; they're pressure points. Trading near $0.1305 means the market's holding its breath. A clean bounce here could signal accumulated buyer interest, a belief that the asset's been oversold. A decisive break below, however, opens the door to lower valuations as stop-losses get triggered and sentiment sours. Technical analysis in this space often feels like reading tea leaves during a hurricane—but everyone's still watching the cup.
Sentiment vs. Structure
Price predictions live in the messy intersection between on-chain data and crowd psychology. The 'support' narrative itself can become a self-fulfilling prophecy, attracting buyers precisely because it's a widely watched level. Conversely, if that faith cracks, the fall can be swift. It's the classic crypto dance: fundamentals whisper while the charts scream.
The Bigger Picture Play
For the bulls, holding this line is about more than a single price point. It's about maintaining a structural foundation for a potential recovery narrative. A successful defense builds a case for resilience, a story that this isn't just another altcoin drifting aimlessly. For the skeptics, it's just another number on the way down—because in traditional finance, they'd call this 'finding a bottom,' but in crypto, we call it 'hopium.'
The verdict? The market's about to cast its vote. Watch the order books, watch the volume. This isn't speculation; it's real-time crowd psychology playing out in a digital ledger. Place your bets accordingly.

Recent attempts at recovery remain limited, leaving traders focused on whether the asset can reclaim key resistance zones or risk extending its current downtrend further.
Market Structure as HBAR Price Holds $0.128 Support
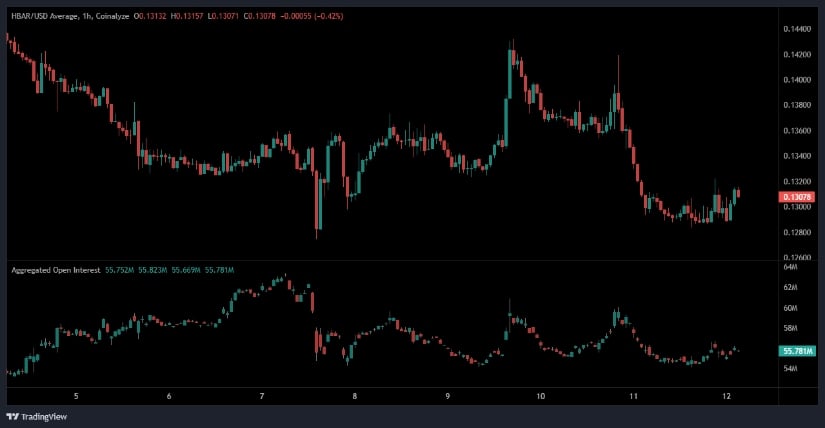
The 1-hour chart shows the token analysis centered on persistent downside pressure as the asset trades between $0.1307 and $0.1310. Earlier movement NEAR $0.142–$0.144 marked the beginning of a steady decline, with buyers unable to hold initial levels.
A short consolidation around $0.135–$0.137 follows, but momentum proves insufficient, leaving sellers in control. This loss of strength leads to a sharp breakdown below $0.132, establishing a new lower low and signaling continuation of the broader bearish structure.
Source: Open Interest
Attempts to recover toward the $0.138–$0.140 zone meet firm resistance, where sellers once again reclaim control and push price back toward the $0.128–$0.130 area.
Aggregated open interest mirrors this weakening trend, fluctuating between 55.6M and 62M and falling sharply during each sell-off.
The latest reading around 55.78M indicates cautious re-entry from traders, but not the type of conviction needed for sustained momentum. For now, the token outlook remains bearish unless price breaks and holds above $0.135.
Market Behavior Near the $0.1300–$0.1313 Zone
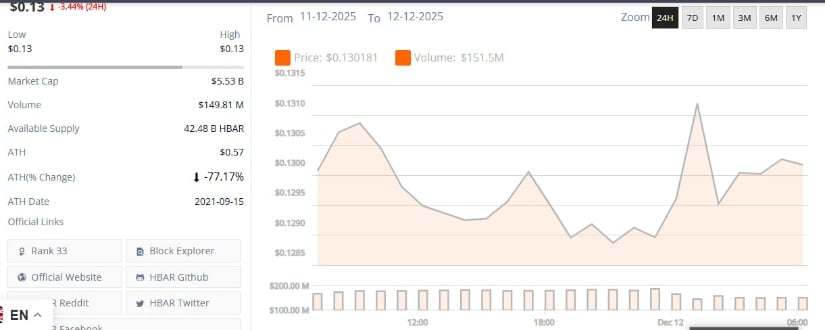
On the 24-hour chart, the coin shows the asset trading between $0.1285 and $0.1315, with the current price near $0.130181. Early in the period, the token climbed modestly from $0.1298 to the $0.1309–$0.1310 region, signaling a brief attempt at upward momentum.
This MOVE is short-lived, as price gradually retreats toward the $0.1290 support zone, where it stabilizes and forms a temporary base before the next movement.
Source: BraveNewCoin
A rounded bottom structure emerges between $0.1288 and $0.1292 mid-period, showing a period of stabilization before another upward push brings price toward the $0.1313 high. After the spike, the token settles within the $0.1300–$0.1304 range, reflecting mild volatility and balanced participation.
Daily trading volume around $151.5 million and a market cap of $5.53 billion indicate steady market engagement. These conditions support a cautiously neutral tone within the broader coin framework, with buyers showing limited but improving interest.
HBAR Price Prediction: Daily Bearish Structure Signals
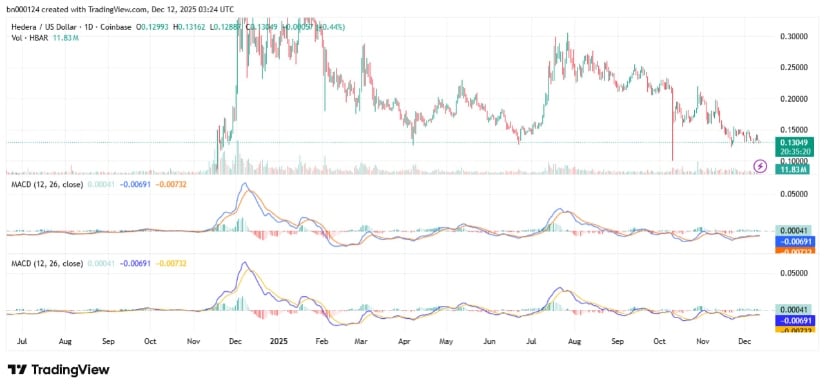
The daily chart reinforces a negative outlook for the token assessments, as price continues to follow a multi-month bearish trajectory. Failure to sustain movement above the $0.20–$0.25 zone earlier in 2025 resulted in progressively lower highs and weakening bullish momentum.
Current price action near $0.1305 remains only slightly above the recent $0.1288 low, highlighting the strength of ongoing downward pressure and the lack of strong recovery signals.
Source: TradingView
The MACD indicator further confirms bearish dominance, with both displayed instances remaining below the zero line. The MACD line at 0.00041, signal line at 0.00691, and histogram at 0.00732 indicate no emerging bullish crossover, maintaining the view that buyers have yet to regain meaningful control.
Support sits near $0.125–$0.130, while resistance around $0.150 must be reclaimed for any structural improvement. Within the token, a reversal remains unlikely without stronger momentum confirmation.
