Dogwifhat Price 2030: Why the Bearish Momentum Could Be Your Golden Opportunity

Forget the short-term noise. The real story for Dogwifhat isn't today's chart—it's the runway to 2030. While bears are growling across every timeframe, seasoned crypto veterans know this script. Deep corrections often lay the groundwork for the next generational rally.
The Long Game: A Market Reset
Current bearish momentum isn't a death knell; it's a market-wide recalibration. It shakes out weak hands and over-leveraged positions, consolidating value into stronger, more conviction-driven holders. This is the painful, necessary process that historically precedes massive breakouts.
Catalysts on the Horizon
By 2030, the entire digital asset landscape will be unrecognizable. Broader institutional adoption, refined regulatory frameworks, and next-generation blockchain scalability solutions will be table stakes. Memecoins like Dogwifhat that survive this purge won't be seen as jokes—they'll be viewed as resilient community assets with proven staying power in the most brutal conditions.
The contrarian play is clear. While traditional finance pundits cluck about 'irrational exuberance' from their leather chairs, the smart money is quietly accumulating assets the crowd has given up on. Dogwifhat's 2030 price won't be dictated by today's fear, but by the network effects and cultural cachet built through this cycle. Sometimes, the hat is just a hat. Other times, it's a flag planted on the moon.

The asset has dropped sharply from its recent highs, and both price action and derivatives metrics now show a market shifting into a defensive state. With momentum indicators flashing continued weakness, WIF enters a critical zone where volatility may soon expand.
Sharp Breakdown on 1H Chart as Open Interest Falls
On the 1-hour timeframe, WIF/USDT has spent several days forming a steady upward grind, with price pushing from the lower $0.30 region toward $0.39–$0.40. This early portion of the chart shows a constructive uptrend marked by higher highs and sustained buyer interest.
However, once the rally stalls NEAR $0.40, momentum begins to fade. Price transitions into a choppy, sideways pattern, with candles showing reduced volatility and mixed direction. This flattening behaviour typically indicates that buyers are losing dominance while sellers quietly begin to re-enter the market.
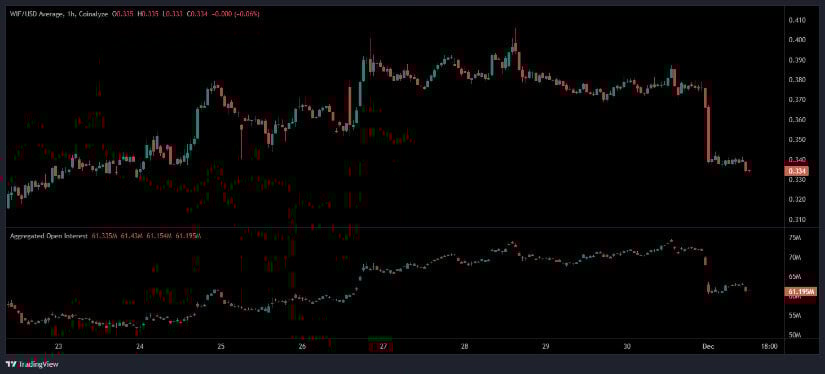
Source: Open Interest
The final segment of the chart reveals the key shift: a sudden breakdown, dragging the coin from the $0.36–$0.38 area toward $0.33–$0.34. This sharp drop marks the strongest bearish impulse of the observed period, signalling that support has failed and short-term sentiment has flipped decisively negative.
Open interest provides crucial confirmation of this shift. Through the uptrend, OI climbs steadily toward the 74M–75M region, showing traders aggressively opening new positions during the bullish run. But as soon as price begins to stall, open interest gradually declines, reflecting position-closing and reduced conviction.
When the breakdown hits, OI collapses more sharply, falling back toward 61.2M. This indicates not only long liquidation but also a broader drop in trader participation. Markets often interpret shrinking OI combined with a steep price drop as a sign that the MOVE is driven by exiting longs rather than aggressive new short positions.
The current environment, with price and OI both depressed and stable, suggests low momentum and a wait-and-see stance among traders until new catalysts emerge.
WIF Drops 3.25% as Liquidity Stays Elevated
BraveNewCoin lists dogwifhat at $0.37, with a market capitalisation of $368,498,237 and a 24-hour volume of $79,811,459. Despite the weekly downtrend, liquidity remains strong, showing that interest in the meme-coin remains elevated even as the price breaks down from recent highs.
The coin currently ranks #194, supported by an available supply of 998,926,392 tokens. While the coin continues to benefit from a strong community presence, short-term traders appear hesitant to re-enter until technical conditions stabilise.
Downtrend Confirmed as MACD and CMF Stay Negative
On the daily chart, WIF has formed a clear and persistent downtrend since its peak of $1.393. The most recent daily candle reflects an 8.47% drop, underscoring the strength of current bearish momentum.
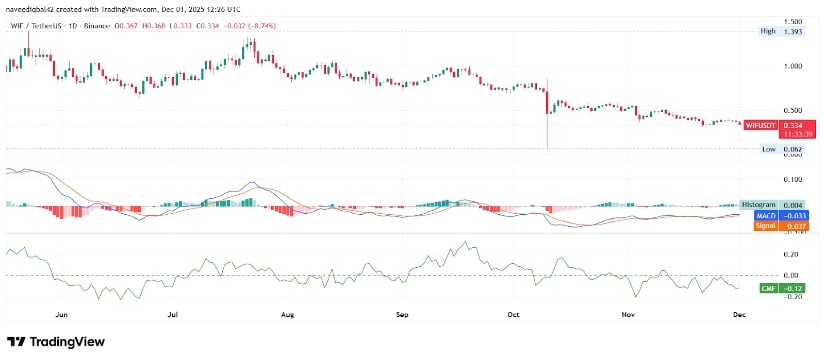
Source: TradingView
The MACD remains firmly in bearish territory. The MACD line sits at –0.033, with the signal line at –0.037, both below zero. While the histogram is slightly positive at 0.004, this is not enough to signal reversal — especially with both lines still deeply negative. This positioning highlights weakening momentum with no clear bullish signal on the horizon.
Chaikin Money Flow (CMF) reads –0.12, indicating persistent capital outflows. Sellers continue to dominate volume-weighted pressure, and the negative CMF confirms that buying interest is neither strong nor sustained. For a meaningful reversal, CMF WOULD need to climb back above zero while MACD shows a positive crossover.
