XRP Price Alert: Bulls Defend $2.30 Support Post Triangle Breakout—But 200 SMA Looms as Critical Resistance

XRP's tug-of-war between bulls and bears heats up as price action carves a decisive narrative.
Key Levels in Play
The $2.30 demand zone—now confirmed as support—becomes the battleground after XRP shattered its symmetrical triangle pattern. But overhead resistance at the 200-day moving average threatens to cap upside momentum.
Market Psychology at Work
Traders eyeing the 200 SMA like hawks—break it, and FOMO could trigger a liquidity grab. Fail, and we're back to watching 'support hunters' pretend they saw the rejection coming all along.
One immutable law remains: The market will always humble both permabulls and doom-mongers with equal glee.

The cryptocurrency is now reacting to the 4-hour 200-period Simple Moving Average (SMA)—a widely watched trend indicator that often acts as a decision point for medium-term traders. With early ETF momentum still influencing sentiment and evidence of accumulation building near local support, XRP’s next move in November 2025 will depend on how the price behaves around this confluence of technical factors.
Descending Channel and Demand Zone Point to Key Price Floor
At the time of writing, XRP trades around $2.306, down about 2.1% over the past 24 hours, with daily trading volume topping $7.7 billion. Despite short-term weakness, XRP remains inside a broad descending channel that has guided price action since early October. The lower boundary of this channel overlaps with a historically significant demand zone between $2.23 and $2.30—a level where XRP has repeatedly shown strong buyer interest.
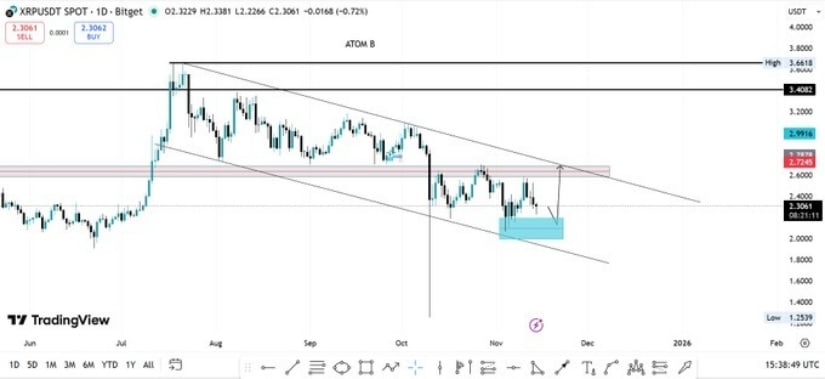
XRP tests a key demand zone in a descending channel, with a potential rebound toward $2.72–$2.78 or a drop if support fails. Source: @aT0m_B via X
The chart shared by market watcher aT0m_B highlights this area, but beyond the social-media commentary, the zone aligns with multiple technical factors: prior reaction points, elevated volume profiles, and repeated wick rejections over the last several weeks. When price revisits such zones with clear absorption of sell-side pressure, it typically indicates that buyers are defending the structure.
If this support holds, XRP could attempt to revisit the $2.72–$2.78 region, which is reinforced by both horizontal supply levels and previous channel midline reactions. However, a clean breakdown below $2.23 WOULD expose XRP to a deeper retracement, likely toward the next liquidity pocket around $2.10–$2.15.
Triangle Breakout and 200 SMA: A Technical Confluence to Watch
XRP recently broke out of a multi-week symmetrical triangle—a pattern that generally signals that volatility expansion is near. On the 4-hour chart, the breakout briefly pushed the price above the 200 SMA, a trend marker used by institutional and algorithmic traders to assess directional bias.
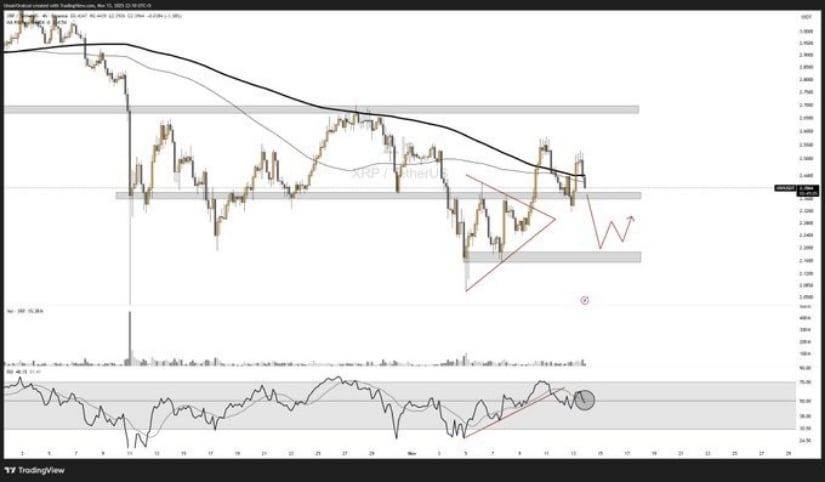
XRP hovers NEAR key 50 RSI support after rallying above $2.52, with a potential move toward $2.67 if it holds $2.35–$2.38 support. Source: @Umairorkz via X
According to chart data reviewed across multiple exchanges, XRP tapped the prior swing high near $2.55 before pulling back. This rejection coincided with a neutral reading on the Relative Strength Index (RSI) near 50, suggesting a pause rather than immediate continuation.
The support band between $2.38 and $2.35 now represents a structural pivot. This area includes the triangle’s retest zone, a 0.382 Fibonacci retracement, and a small volume imbalance—creating a multi-layered region traders often monitor for confirmation.
A sustained hold above this zone could allow XRP to revisit $2.67, the next key short-term resistance. Conversely, falling below the structure risks a shift toward $2.22, which marks the base of the recent impulse MOVE and the midpoint of the descending channel.
Hammer Reversal Shows Accumulation, but Confirmation Is Key
Recent candlestick behavior inside the $2.24–$2.28 region shows a hammer formation on elevated volume—a signal often associated with buyers absorbing sell orders. From a technical perspective, hammer formations in long-standing demand zones indicate that market participants are defending the area with limit orders rather than chasing with aggressive market buys.
This can reflect early-stage accumulation, but confirmation requires subsequent higher lows and closing strength.
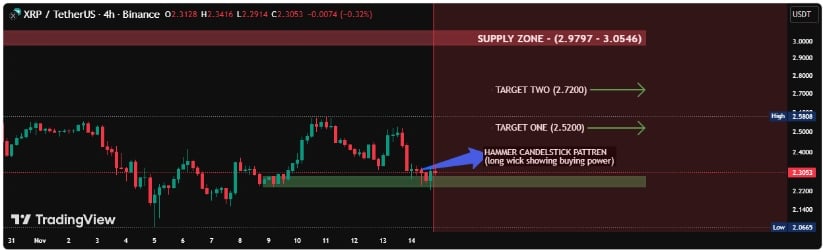
XRP forms a hammer reversal in the $2.24–$2.28 demand zone, signaling potential upside targets at $2.52 and $2.72. Source: coinpediamarkets on TradingView
Key signals currently observed:
- Repeated absorption: Multiple candles show lower wicks, implying that sell-side liquidity is being swept and absorbed.
- Order-flow alignment: The structure suggests planned entries rather than reactive buying, a trait sometimes associated with institutional accumulation phases.
- Overhead supply: Major resistance remains at $2.98–$3.05, a zone that historically capped impulsive rallies.
Immediate upside levels include $2.52 and $2.72, but the bullish case is invalidated if the 4-hour candle closes below $2.24—the lower boundary of current accumulation.
ETF Launches Improve Liquidity Outlook, but Risks Remain
Canary Capital’s recently launched spot XRP ETF recorded $58 million in first-day trading volume, according to issuer and exchange data. This marks a meaningful step for XRP’s institutional accessibility after years of regulatory hurdles.
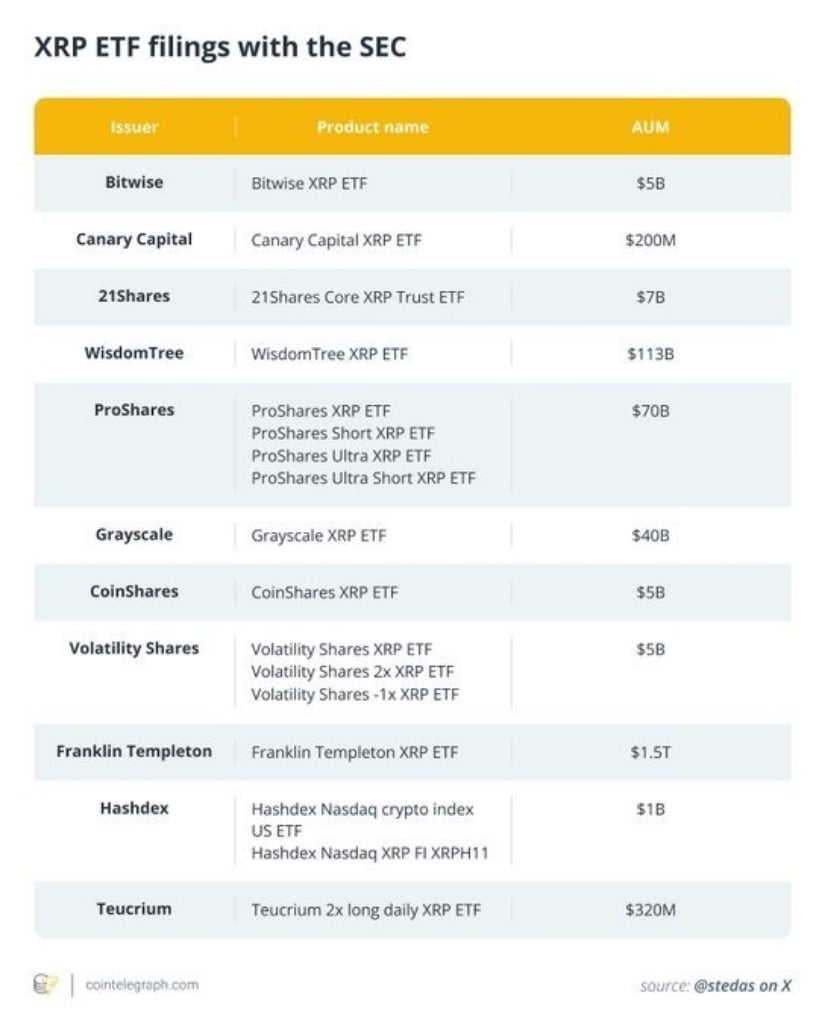
Only one XRP ETF launched today, hinting at major market impact when the remaining 10 ETFs debut. Source: @XRPcryptowolf via X
Additionally, 11 more XRP ETFs await review, based on SEC filing schedules. If approved, these funds could improve market depth and broaden participation, though any supply-impact projections remain speculative until inflows materialize.
- ETF approval timelines may shift, affecting near-term liquidity assumptions.
- Macro conditions, including U.S. equity volatility and dollar liquidity cycles, could influence demand across the crypto sector.
- Historical ETF launches often lead to short-term volatility before establishing stable inflow patterns.
For now, ETF developments should be viewed as a supportive—but not deterministic—factor for XRP’s price trajectory.
Final Thoughts
XRP is positioned at a decisive point where major technical and fundamental elements intersect. The 4H 200 SMA, the descending channel’s demand zone, and the triangle retest collectively FORM a crucial battleground. Meanwhile, ETF inflows and regulatory clarity provide a more stable backdrop than in previous cycles.

XRP was trading around 2.32, down 1.14% in the last 24 hours at press time. Source: xrp price via Brave New Coin
If buyers defend support above $2.30, XRP may attempt a push toward $2.72 and, eventually, the broader supply zone near $3.00. Failure to hold the $2.23–$2.24 zone would shift the outlook toward a corrective structure.
For traders monitoring XRP price live, the next steps hinge on volume behavior, candlestick confirmation, and ETF-related liquidity trends—all of which will determine whether the current accumulation evolves into sustained momentum or fades into another consolidation phase.
