Chainlink Approaches Critical Triangle Pattern Breakout - Here’s What Comes Next

Chainlink's price consolidation reaches its final stages as the long-term triangle pattern tightens toward resolution.
The Technical Setup
LINK has been tracing converging trend lines for months, creating a textbook symmetrical triangle formation. Each bounce off support and rejection at resistance has narrowed the trading range, pushing volatility to near-record lows. This compression typically precedes explosive moves—and the breakout direction will determine LINK's trajectory for the coming quarter.
Key Levels to Watch
Traders are monitoring the triangle's upper boundary around $18.50 as immediate resistance. A decisive close above this level with strong volume could trigger a 40-60% move upward, targeting the $26-30 zone. Conversely, breakdown below $14.80 support would invalidate the bullish setup and potentially send LINK retesting $12.50.
Market Context
The entire oracle sector faces increased scrutiny as DeFi protocols demand more reliable data feeds. Chainlink's dominance position gives it an edge, but competitors are emerging with cheaper alternatives. Because nothing says 'financial revolution' like fighting over who provides the most accurate numbers for digital monkey pictures.
With volatility indicators flashing and options volume surging, LINK stands at a technical crossroads that could define its 2025 performance in one decisive move.

A sustained MOVE above $20 could trigger a rally toward $30, marking renewed investor confidence ahead of late 2025.
Long-Term Triangle Structure Suggests Imminent Move
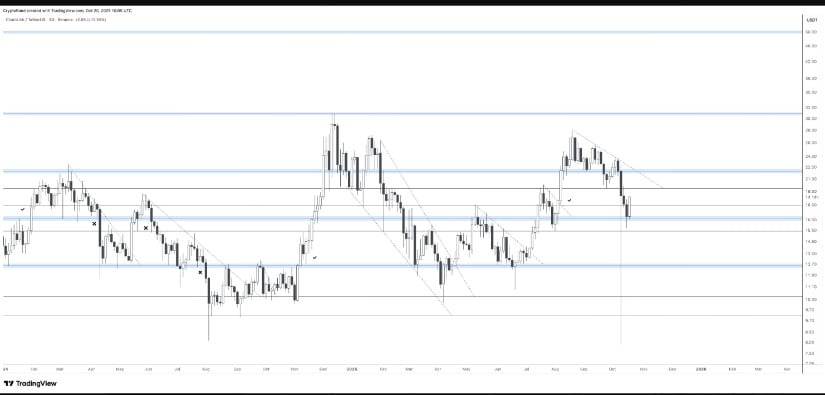
Analyst Satoshi Flipper described Chainlink’s current setup as a “monster Q4 setup,” noting that the token has spent months forming higher lows and lower highs within a contracting range. This symmetrical triangle formation typically indicates a tightening equilibrium between buying and selling pressure. Its current position NEAR the pattern’s upper boundary points to a possible resolution in the near term.

LINKUSDT 1-WK Chart | Source:x
According to Satoshi Flipper’s weekly chart analysis, the asset has consistently respected its ascending trendline support since mid-2023. The ongoing consolidation period has created a structural base, often associated with accumulation phases before large market expansions. A confirmed breakout above the upper boundary could open price targets around $30 if bullish momentum continues.
Analysts Observe Renewed Accumulation Near $17 Support
Analyst Rand noted that the recent rebound from the $17 support area indicates renewed accumulation by long-term holders. The price reaction around this level halted a brief correction and maintained the integrity of the asset’s broader bullish framework. Historical data shows that similar rebounds from this zone have triggered rallies toward the $21–$25 range.
LINKUSDT Chart | Source:x
The $16.5–$17.0 area continues to serve as a crucial demand zone where institutional and retail buyers have shown consistent interest. Rand’s analysis suggests that maintaining support above this level could reinforce bullish sentiment and lay the groundwork for a potential trend reversal. A move above $20 may confirm this outlook, paving the way for further upward movement.
Market Data Reflects Renewed Buying Interest
Chainlink is trading at $17.03, marking a 1.48% gain in the past 24 hours. Trading volume surged to $693.4 million, signaling heightened participation around key technical levels. The market capitalization stands at $11.86 billion, securing its position as the 17th largest cryptocurrency by market value. This increase in trading activity supports the view that traders are positioning ahead of a potential breakout.

LINKUSD 24-Hr Chart | Source: BraveNewCoin
Intraday price movements show that the token oscillated between $17.00 and $17.50 before briefly testing $18.60, indicating visible resistance near the upper boundary. Despite this, the token maintained support near the lower end of the range, showing short-term stability and reduced selling pressure.
Key Levels to Watch Ahead of Potential Breakout
Technical charts identify $18.50–$19.00 as the next immediate resistance range. A sustained move above this threshold could confirm a short-term breakout, aligning with the bullish scenarios presented by both analysts. If momentum continues, LINK could test higher resistance at $22.5 and $30.
Conversely, failure to hold above $17 may expose the asset to a retest of $16.5, the lower limit of the recent consolidation. Maintaining support above this zone remains vital for preserving the current market structure. As chainlink approaches the apex of its long-term triangle pattern, traders are watching closely for confirmation of direction in the sessions ahead.
