HBAR Price Pattern Echoes Previous Peaks - Correction Fears Mount

HBAR's chart is flashing warning signs that seasoned traders know all too well.
The Uncomfortable Déjà Vu
Current price action mirrors historical tops that preceded significant pullbacks. Same formations, same indicators flashing red - it's like watching market history repeat itself while your portfolio holds the bag.
Technical Breakdown
Resistance levels that held strong during previous cycles are being tested again. Volume patterns suggest distribution, not accumulation. The classic signs are all there if you know where to look.
Market Psychology at Play
When assets start tracing familiar patterns, human nature takes over. Greed gives way to caution, momentum stalls, and suddenly everyone remembers that what goes up must eventually take a breather - or worse.
Correction probabilities are rising faster than a crypto influencer's follower count after a single accurate prediction. Sometimes the market's memory is longer than investors' attention spans.

However, with nearly 100% of tokens now in circulation, HBAR enters a zero-inflation phase where demand, adoption, and network utility will drive future price performance and long-term market stability.
Analyst Warns of Potential Correction Phase
The chart shared by analyst @MASTERBTCLTC on X indicates a bearish long-term outlook for Hedera. The analysis shows a recurring pattern of cyclical tops followed by sharp retracements, signaling that the asset may be approaching another correction phase.
The structure presents three major peaks forming along a consistent descending resistance line labeled “TOP.” Each previous instance of this pattern led to substantial declines toward defined accumulation zones, shown by rectangular areas on the chart.
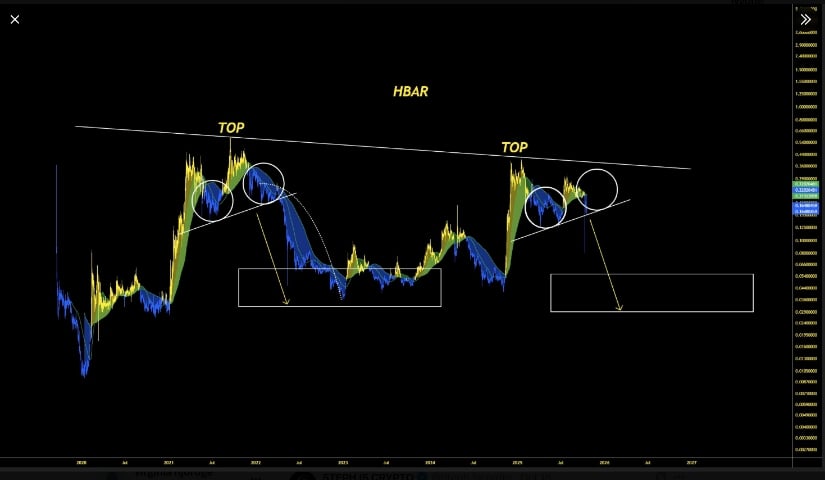
HBAR Chart | Source: x
The analyst’s projection suggests that it may follow the same pattern once again. Historical formations on the chart reveal that after each top, the price retraced into a lower consolidation range before beginning a new cycle. Based on this repetition, the asset could potentially revisit the lower support range estimated between $0.03 and $0.05 if the bearish formation develops as anticipated. The setup appears to reflect long-term weakness in the market structure and reduced buying momentum around the upper resistance area.
Rising Wedge Pattern Near Resistance Levels
According to Master, the cryptocurrency has been trading within a rising wedge formation, a technical structure often associated with trend exhaustion. In previous cycles, similar wedges formed after recovery rallies and preceded steep declines once the price broke below the pattern’s lower boundary. The use of circular markers and directional arrows on the chart emphasizes how the token has historically failed to maintain upward momentum near resistance before reversing sharply.
Currently, the token trades close to $0.22, where it faces overhead resistance consistent with prior cycle tops. The wedge pattern suggests limited upside potential in the NEAR term, with the risk of a breakdown increasing if momentum fades.
The descending trendline connecting past peaks continues to cap bullish attempts, suggesting a technical ceiling that has remained unbroken for several years. The analysis implies that if this resistance remains intact, the asset may see renewed downward pressure as part of its repeating price structure.
Token Circulation Reaches Completion
Another observation from analyst Gilmore_Estates shows that Hedera’s total token supply has now reached nearly full circulation. The circulating supply closely follows the projected release curve, confirming the completion of the token issuance phase.
The network’s total supply stands at 50 billion, with nearly all tokens now released to the market. This development marks the end of Hedera’s token distribution process, reducing the risk of inflation from future supply increases.
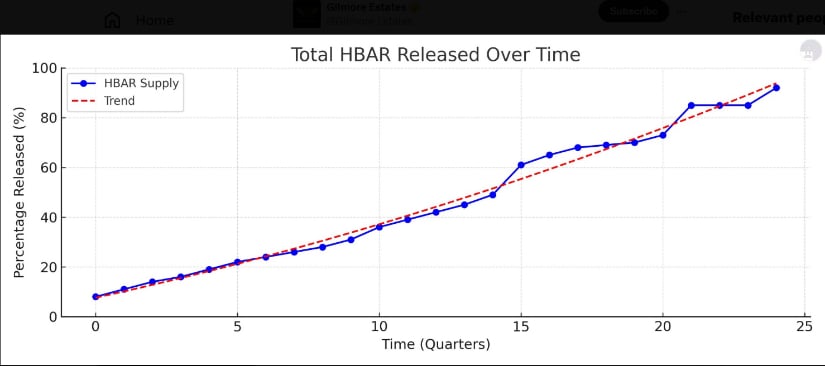
HBAR Chart | Source:x
The completion of circulation introduces stability into Hedera’s tokenomics. Since no additional tokens are expected to enter the market, price movement will be determined by demand rather than supply expansion.
This state allows investors to focus on network adoption, transaction growth, and staking participation as key drivers of future valuation. The absence of new issuance positions the asset in a mature phase of its lifecycle, with emphasis shifting toward usage-based growth.
Market Performance and Trading Outlook
At the time of writing, the altcoin traded around $0.16, registering a daily gain of 0.96%. The token displayed moderate volatility within a narrow range between $0.163 and $0.168, reflecting a phase of short-term consolidation. Trading volume over the same period reached approximately $145 million, suggesting steady market activity amid a balanced mix of buying and selling pressure.
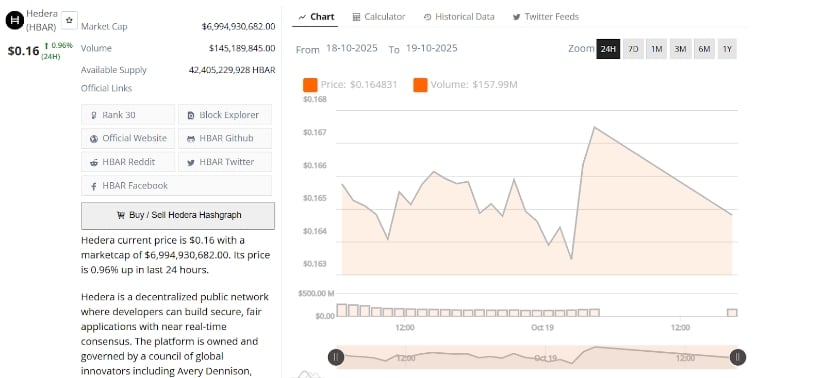
HBARUSD 24-Hr Chart | Source: BraveNewCoin
Short-term price behavior indicates cautious accumulation by traders, with intermittent rebounds near intraday lows. A sustained MOVE above $0.17 could open the possibility of a minor breakout attempt, while a drop below $0.163 might extend selling pressure.
With an estimated 42.4 billion in circulation and a market capitalization near $7 billion, the token is now viewed as entering a supply-saturated phase. Future performance is expected to depend on demand expansion, ecosystem activity, and broader market trends rather than token unlocks or new issuance.
