FLOKI Defends Critical Demand Zone as Bulls Position for Explosive Breakout

FLOKI isn't just holding ground—it's defending the last line before a potential price explosion. The memecoin that refuses to die keeps bouncing off that crucial demand zone like it's got something to prove.
Technical Tension Builds
Buyers keep stacking positions while the charts scream consolidation. Every test of that support level brings more volume, more interest, more of that delicious market tension that precedes big moves. The pattern's so clean you could eat off it.
Breakout or Breakdown?
Either this thing rockets past resistance and makes early believers look like geniuses, or it cracks support and becomes another cautionary tale about chasing memecoins. Because nothing says 'sound investment' like betting on dog-themed tokens in a market that changes direction faster than a politician's promise.
The setup's perfect, the timing's ripe, and the community's buzzing. Now we wait to see if FLOKI delivers the goods or just another 'should've sold' story.

Despite broader market uncertainty, the asset continues to defend its lower structure, hinting that buyers are gradually regaining control.
Rising Volume and Buy Pressure Signal Growing Interest
In a recent X post, an analyst reported that FLOKI’s trading volume surpassed $47 million, signaling rising interest across major exchanges. This uptick in activity coincides with price consolidation NEAR a key demand zone, where buyers have repeatedly absorbed selling pressure.
Analysts noted that increased buy-side momentum may reflect early positioning ahead of a possible breakout, particularly as market sentiment shifts from fear to cautious optimism.
Source: X
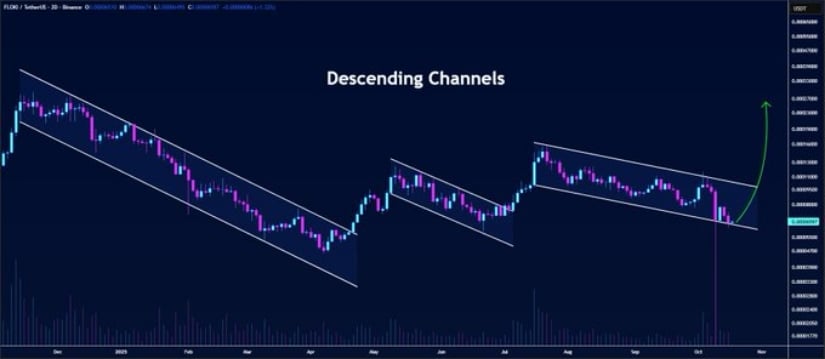
According to @butterfly_chart, the crypto currently trades near the lower boundary of a descending channel on the two-day chart, a technical level that has historically marked accumulation phases before bullish reversals.
Previous rebounds from similar setups have led to notable upward movements, suggesting that sustained defense of this zone could pave the way for another upward push. If confirmation of a reversal emerges, the token could attempt to reclaim higher resistance levels, reinforcing the view that market participants are positioning for a renewed bullish cycle.
Market Data Shows Steady Market Performance
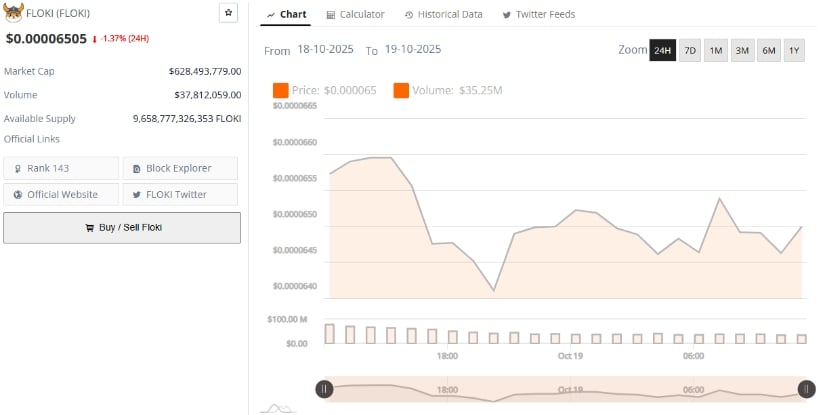
On the other hand, the coin trades at $0.00006505, down 1.37% in the past 24 hours, with a market capitalization of $628.49 million and daily volume exceeding $37.81 million. The circulating supply stands at 9.65 trillion tokens, ranking the token 143rd globally.
Despite the modest dip, the token maintains strong liquidity and active participation across exchanges, reflecting stable underlying demand even amid broader corrections in the meme coin sector.
Source: BraveNewCoin
While short-term volatility persists, trading data suggests that speculative flows have begun to stabilize following a reduction in extreme leverage. Market participants appear to be recalibrating around fundamental support zones, reducing the likelihood of deeper corrections as long as buying activity remains consistent near current levels.
Technical Indicators Suggest FLOKI Near Oversold Territory
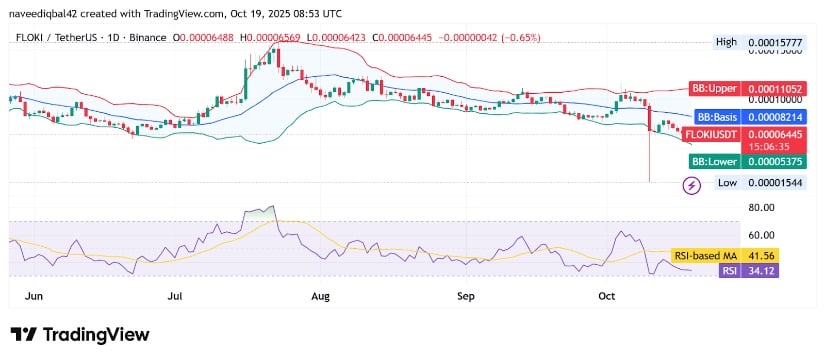
At the time of writing, FLOKI/USDT trades around $0.00006461, positioned near the lower Bollinger Band at $0.00005378, with the basis line at $0.00008214. The coin’s proximity to the lower band reflects compressed volatility and potential oversold conditions after an extended pullback. Historically, this setup has preceded recovery attempts once momentum indicators begin to stabilize.
Source: TradingView
The Relative Strength Index (RSI) currently reads 34.22, below the neutral midpoint of 50, confirming weakened momentum but also highlighting growing potential for a rebound. The RSI-based moving average stands at 41.57, suggesting that downward momentum may be losing strength as price approaches technical support.
If the crypto manages to hold above the $0.000064 region and the RSI begins to trend upward, the memecoin could see a short-term rally toward the $0.000082–$0.000110 resistance range. Conversely, failure to defend current support could expose it to further downside near $0.000053, aligning with the lower Bollinger limit. For now, market signals favor consolidation with a possible upside breakout if volume and momentum continue to align.
