DXY Collapse Sparks Bitcoin Surge – Is This the Big One?

The dollar's stumble might just be crypto's stepping stone. As the DXY index fractures, Bitcoin bulls are licking their chops—ready to pounce on what could be the next macro-driven rally.
Greenback crumbles, orange coin rumbles
When the world's reserve currency wobbles, digital gold tends to shine. Traders are watching the inverse correlation play out in real time—with BTC's price action looking increasingly coiled.
Wall Street's 'risk-off' darling (the dollar, obviously) suddenly can't catch a bid. Meanwhile, Bitcoin's weekly chart prints the cleanest consolidation pattern since the last cycle's breakout. Coincidence? The crypto crowd thinks not.
Just don't tell the Fed
While central bankers obsess over lagging indicators, the smart money's already positioning. Funny how 'unsophisticated' crypto traders keep front-running institutional plays—almost like the market's more efficient when it's not choked by compliance theater.
One thing's certain: if this DXY breakdown holds, Bitcoin won't be the only asset mooning. But it'll be the only one doing so while Wall Street analysts scramble to justify their outdated models.
Bitcoin Awaits Breakout As Dollar Weakness Builds A Bullish Backdrop
Bitcoin and the broader crypto market remain in a state of eerie calm. Price action has stalled, with no clear breakout or breakdown across major assets. Bulls are increasingly optimistic, eyeing a breakout that could send BTC into uncharted territory. Meanwhile, bears maintain a cautious stance, expecting either prolonged consolidation or a sharp correction if key support levels fail.
According to Darkfost, macroeconomic conditions could soon tilt the balance. While the US national debt just reached a new all-time high, the US Dollar Index (DXY) is trading at historically weak levels, currently 6.5 points below its 200-day moving average. That marks the largest downside deviation in over two decades. Although such a development might seem troubling for traditional markets, it often signals strength ahead for risk assets like Bitcoin.
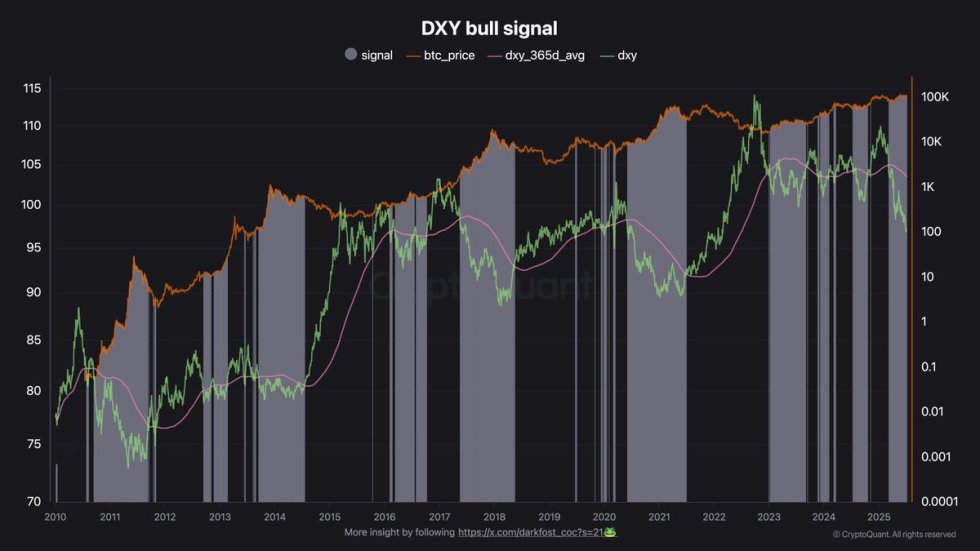
This inverse correlation between the dollar and Bitcoin is well-documented in traditional finance. When the DXY weakens and loses its safe-haven status, capital tends to rotate into alternative assets, including crypto. Historical data shows that BTC has consistently outperformed during periods when the DXY trades below its 365-day moving average.
The current environment mirrors those bullish setups. Despite the favorable macro backdrop, Bitcoin’s price has not yet reacted, continuing to trade below its all-time high. This disconnect may reflect market hesitation or a buildup of momentum before a large move. If history repeats, the dollar’s weakness could soon serve as a catalyst for Bitcoin’s next major rally.
BTC Price Holds Steady Below Resistance
Bitcoin continues to trade in a tight range just below its all-time high of $112,000, currently hovering around $109,000. As seen in the daily chart, BTC remains confined between two key levels: $103,600 acting as solid support and $109,300 as resistance. Since late May, the price has consolidated within this zone, building pressure for the next significant move.

The price action shows a consistent pattern of higher lows, indicating that bulls are stepping in to defend key support levels. The 50-day moving average (blue line) sits below the price at $106,742, reinforcing bullish momentum. Meanwhile, both the 100-day and 200-day moving averages are aligned upward, showing a healthy long-term trend.
Despite several attempts, bitcoin has failed to close convincingly above the $109,300 resistance. A daily breakout above this level with strong volume would likely trigger a rally toward price discovery. On the other hand, if the price drops below $103,600, it could open the door for a deeper correction.
Featured image from Dall-E, chart from TradingView
