XRP Coils Under $3: RSI Breakdown Hints at Explosive Price Movement – Analyst Alert

XRP traders are bracing for volatility as technical indicators flash warning signs. The digital asset—stuck below the $3 psychological barrier—shows weakening momentum after its Relative Strength Index (RSI) cracked key support.
Bulls and bears are locked in a tug-of-war, but charts suggest this stalemate won't last. When an asset's RSI breaks structure while price consolidates, it often precedes violent moves. And in crypto? 'Violent' usually means a 20%+ swing in either direction.
Market makers love these setups—nothing like liquidating overleveraged retail positions on both sides of the trade. Meanwhile, the 'fundamentals are strong' crowd keeps HODLing through the chop. Place your bets.
Flush Then Fly? XRP Chart Patterns Point To Key Support Test
In an X post on June 20, CasiTrades postulates that XRP is currently at a technical inflection point with significant bearings on its next price movement. Based on the presented daily trading chart, it can be inferred that the prominent altcoin is on the edge of a price breakout or breakdown due to the formation of a descending triangle pattern. However, CasiTrades states that there are larger implications in recent developments of the relative strength index (RSI). Notably, the analyst explains the XRP daily RSI trendline is now breaking down signaling a confluence of market conditions including declining volatility, muted price action, and, most importantly, an accumulation of pressure within the market which aligns closely with the tightening range seen in the descending triangle.
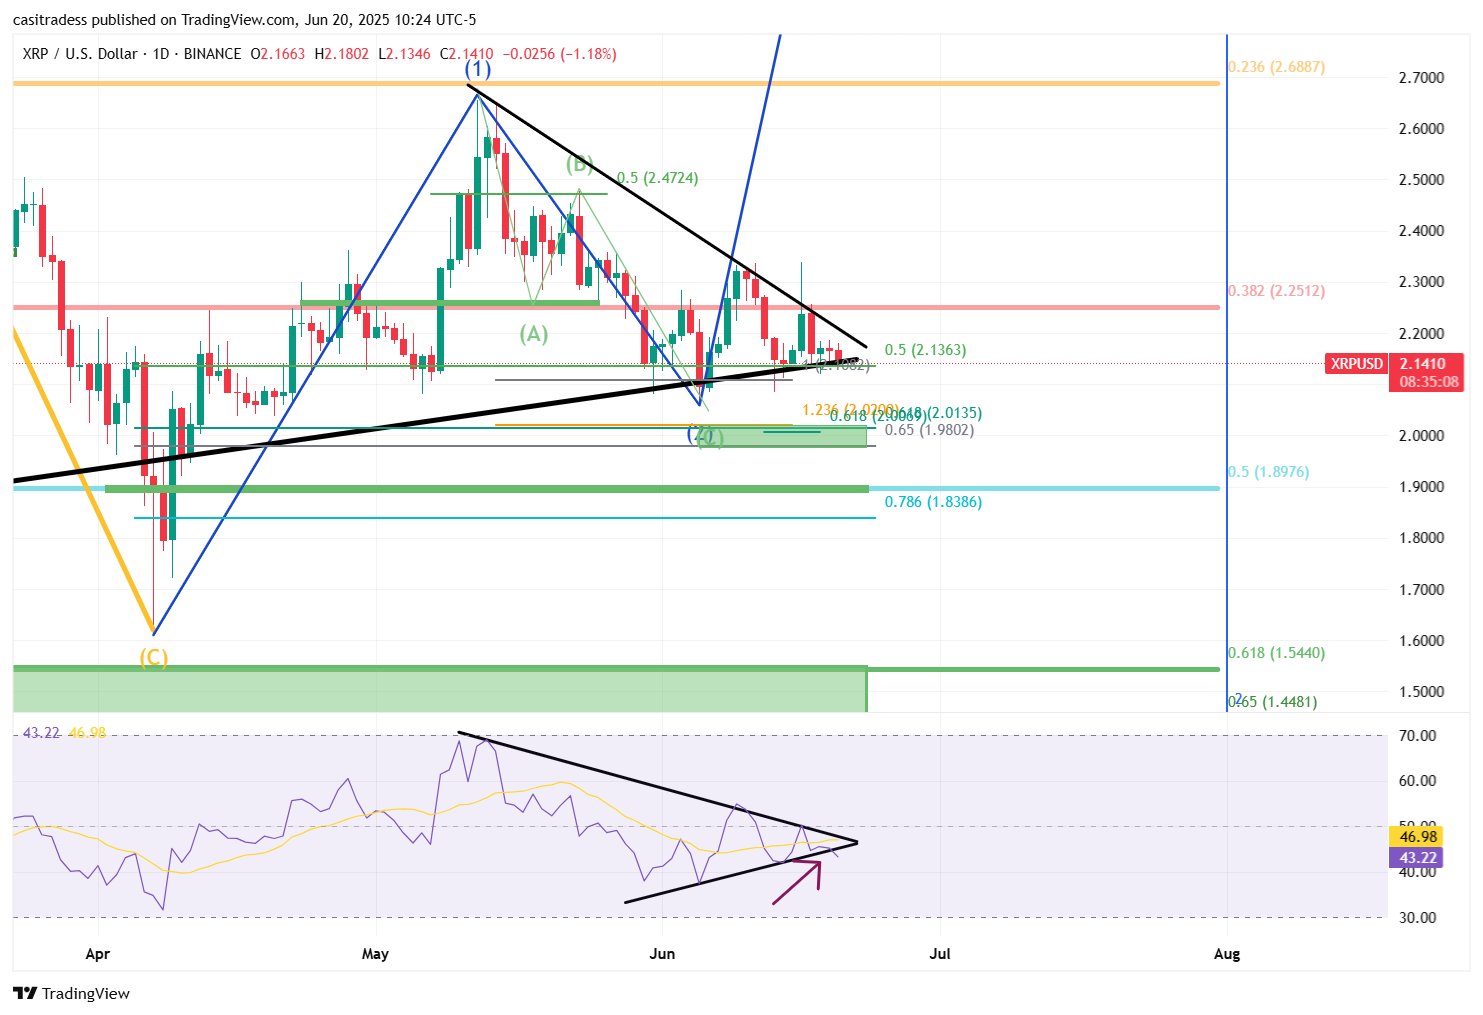
CasiTrades predicts the impending release is likely to initially target lower price regions before initiating a price upswing. The trading expert views this potential breakdown not as bearish price capitulation but rather a final flush needed to gather enough liquidity for a bullish reversal. In this regard, CasiTrades has highlighted potential support zones to be around $2.01, $1.90 and $1.55, all which the analyst states remain valid until XRP achieves a decisive price close above $3. However, the projected bullish reversal may occur via two routes. Firstly, CasiTrades states that XRP could dip cleanly to any of the highlighted supported zones before executing a V-shaped marker recovery that WOULD indicate the altcoin has found a market bottom. Alternatively, XRP may also get close to the support zones and stall or even produce an early price bounce. In this case, the analyst predicts the token may witness a final exhaustion downward wave before the expected bullish reversal.
XRP Price Overview
At press time, XRP trades at $2.13 reflecting a 1.29% price loss in the past day. Meanwhile, the cryptocurrency also retains negative performances on larger time frames with a loss of 10.39% on the monthly chart respectively. In making any price gains, the market bulls must overcome the key resistance level at $2.37, a successful breakout beyond which would pave the way for a rally toward the $2.60 mark.
