Ethereum Nears ’Unbreakable’ Support Line: Accumulators Pounce

Ethereum flirts with a legendary price floor—one that's never been breached. The smart money is moving.
The Line in the Sand
It's the support level traders whisper about. A historical barrier that's absorbed every sell-off, every panic, every macro shock thrown at it. Now, ETH is testing it again. The air is thick with deja vu and discounted assets.
Accumulation Mode Activated
While retail watches the ticker sweat, a different signal flashes for veterans. Large wallets are quietly filling their bags. This isn't frenzied buying; it's systematic, cold-blooded accumulation at a price point proven resilient. They're not betting on a bounce—they're banking on a statistical anomaly holding true.
The Cynic's Corner
Let's be real—in traditional finance, a 'never broken' support line usually means someone's about to get a margin call that breaks it. But crypto isn't playing by the old rulebook. Its patterns are written in code and collective belief, not quarterly reports.
What Comes Next?
History either repeats or shatters. A hold here could trigger a powerful relief rally, validating the accumulators' calculus. A break? That would rewrite the chart and shake faith in every technical indicator on the screen. The market holds its breath at the line that divides conviction from capitulation.
Ethereum Whale Cost Basis Signals a Potential Bottom Zone
CryptoQuant’s report suggests Ethereum may be approaching one of its most important structural support zones, anchored by the realized price of accumulation addresses. This metric tracks the average on-chain cost basis of entities that consistently accumulate ETH, and it often behaves as a “defense line” for whales who build long-term positions.
According to the analysis, this realized price level has historically acted as a reliable floor, with Ethereum never breaking below this range during prior drawdowns, even when broader market conditions turned sharply risk-off.
That historical behavior matters because it implies that accumulation whales tend to protect their cost basis aggressively, either by adding exposure NEAR support or by reducing sell pressure when the price approaches their entry zone. In practice, this can limit downside momentum and create a stabilization area where volatility compresses before the next trend decision.

Based on the current trajectory, the report argues that even if ETH sees another leg down, the most probable “bottom zone” sits near $2,720. From current levels, that WOULD represent an additional pullback of roughly 7%, keeping the move within a controlled correction rather than a full breakdown. If buyers defend this area, Ethereum could begin rebuilding a base for a renewed push back above $3,000.
ETH Price Slips Back Toward $3,000 As Bulls Struggle To Reclaim Control
Ethereum (ETH) continues to trade under heavy pressure as price struggles to stabilize around the $3,000 zone. The chart shows ETH printing another sharp rejection after failing to hold the recent rebound, reinforcing that the market remains in a corrective phase rather than a clean recovery. Even though buyers are attempting to defend current levels, momentum still looks weak, with each bounce being met by renewed selling.
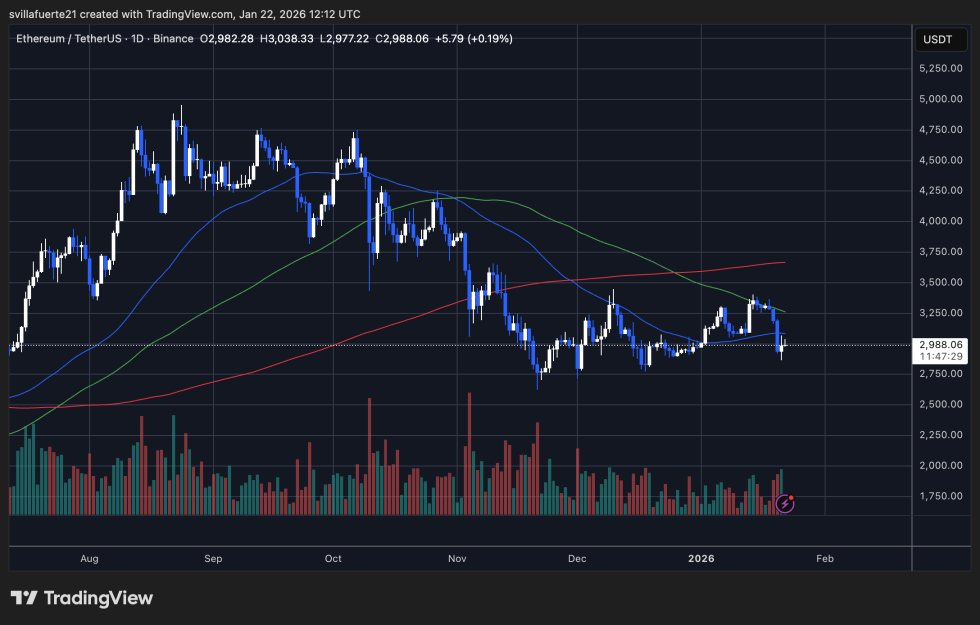
From a technical perspective, ETH is trading below its key moving averages, which highlights how resistance continues to stack above the price. The broader structure suggests a downtrend that is transitioning into consolidation, but without a confirmed breakout, the risk remains tilted to the downside.
The recent push toward the mid-$3,200 region failed to flip that zone into support, and the pullback toward $2,980 signals that bulls are still struggling to build sustainable demand.
Volume remains relatively muted compared to the larger selloffs seen earlier in the cycle, which supports the idea that this is a grinding distribution phase rather than full panic capitulation. For a bullish shift, ETH needs to reclaim $3,200–$3,300 and hold above it. Until then, the $2,900–$3,000 area remains the key line of defense.
Featured image from ChatGPT, chart from TradingView.com
