Nvidia Vs. Dogecoin: A Historic Ratio Suggests A Possible Rotation, Says Trader

Tech meets meme in a chart that's got traders buzzing. A historic ratio between a chipmaking giant and a joke-turned-juggernaut crypto is flashing a signal that could shift billions.
The Setup: When Giants Diverge
For years, Nvidia's stock trajectory and Dogecoin's price action moved in a familiar dance—often correlated with the broader risk-on sentiment in tech and crypto. Now, that relationship is stretching thin. The ratio between them, a metric watched by a niche group of cross-asset analysts, has hit an extreme not seen since the last major market regime change. It's not just a blip; it's a structural shift screaming from the charts.
The Signal: Capital on the Move
What does a strained ratio actually mean? In plain English, it suggests capital is getting restless. Money that piled into the surefire AI bet—the 'adult in the room'—is eyeing the exits, searching for hyperbolic returns elsewhere. Conversely, funds sitting on crypto sidelines might see a relative value play. This isn't about fundamentals; it's about momentum, liquidity, and the herd's short attention span. One asset gets overbought, the other looks oversold—and traders pounce on the differential.
The Implications: A Volatility Engine
If this rotation triggers, hold on. A move from the mature, massive-cap tech sector into the notoriously volatile crypto arena would act like a turbocharger. Dogecoin, with its dedicated community and low barrier to entry, often acts as a liquidity funnel for the broader crypto market. A significant rotation could ignite altcoin season faster than you can say 'to the moon'—while potentially leaving former darlings in the tech sector looking momentarily stale.
The trader's insight cuts through the usual narrative. It bypasses the dogma of 'store of value' versus 'computational revolution' and focuses on raw, gravitational pull of capital. In the end, markets are a voting machine, and right now, the ballot might be swinging from silicon to shiba inu. Just remember—in finance, a 'historic ratio' is often just a fancy way of explaining why yesterday's genius is tomorrow's bag-holder.
Dogecoin Vs. Nvidia: Rotation Incoming?
In a post on X, Cryptollica said the DOGE/NVIDIA chart has returned to a long-term support zone that previously preceded outsized dogecoin outperformance versus Nvidia in prior cycles. “THE SIGNAL IS BACK. IT’S HAPPENING AGAIN (2017… 2021… NOW),” the trader wrote.
“The last two times this specific signal flashed on the DOGE/NVIDIA chart, we saw the biggest wealth transfer in history. The crowd is chasing the AI top. The algorithm is loading the Meme bottom. (Altcoin bottom).”
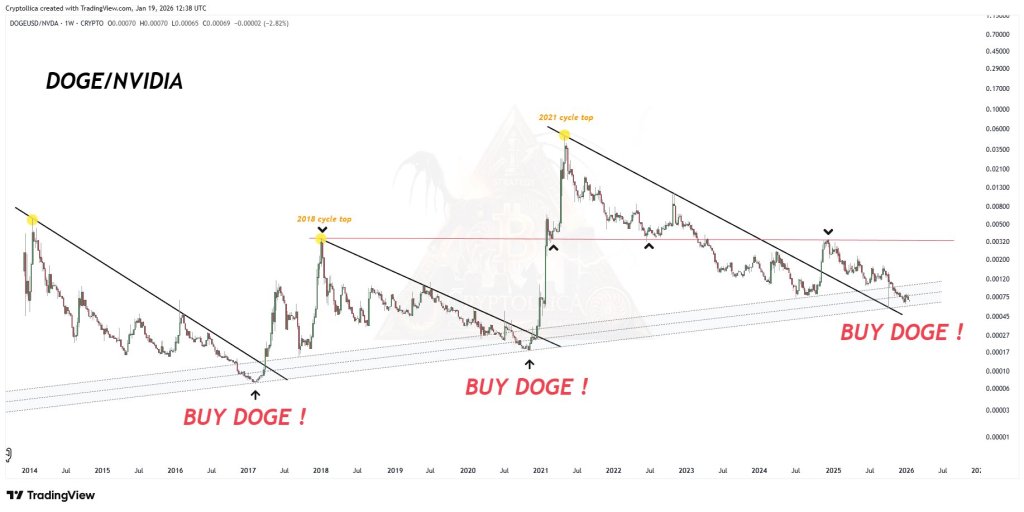
The Core claim is less about Dogecoin in isolation and more about positioning on a ratio between what Cryptollica framed as two cultural extremes: “You are watching the wrong chart. This is the ratio of ‘The World’s Most Valuable Company’ (AI) vs. ‘The World’s Most Famous Meme’.” From that framing, the trader leans into a cycle-rhymes narrative, asserting that the ratio has repeatedly found channel support before a DOGE-led surge.
“Structure is repeating history,” Cryptollica wrote, attaching specific historical comparisons. “2017: Ratio hit channel support – DOGE outperformed NVDA by 100x. 2021: Ratio hit channel support – DOGE outperformed NVDA by 50x. NOW: We are back at the exact same support line.”
The posts also attach a broader liquidity-rotation story that has circulated in various forms across risk markets: when one trade stops working, capital seeks the next high-beta outlet: “When the AI Bubble exhales, that liquidity doesn’t vanish. It rotates into High-Beta Speculation,” the trader wrote. “The crowd is buying NVDA at the top. The algorithm is positioning for the Doge reversal.”
Is Dogecoin An ‘Epic Buying Opportunity’?
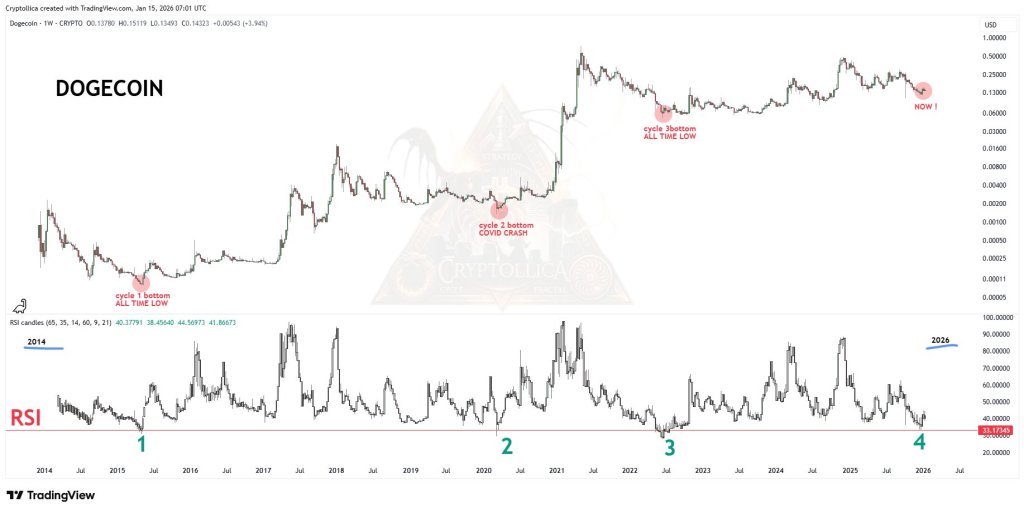
In another post, Cryptollica shifted from the ratio to Dogecoin’s weekly momentum indicator, sharing a second chart highlighting RSI levels and labeling prior cycle lows. “Here you are witnessing an opportunity that only comes around once every 12 years,” the trader wrote. “Over the past 12 years (2014–2026), Dogecoin’s RSI has dropped this low only 4 times. Every single one was an epic buying opportunity.”
The post describes those four moments as a sequence of cycle bottoms, including an “all-time low” first cycle bottom, a “cycle bottom + COVID crash,” a “last cycle bottom,” and “RIGHT NOW!” Cryptollica concluded with a blunt decision frame: “Math or emotions — which one decides for you?”
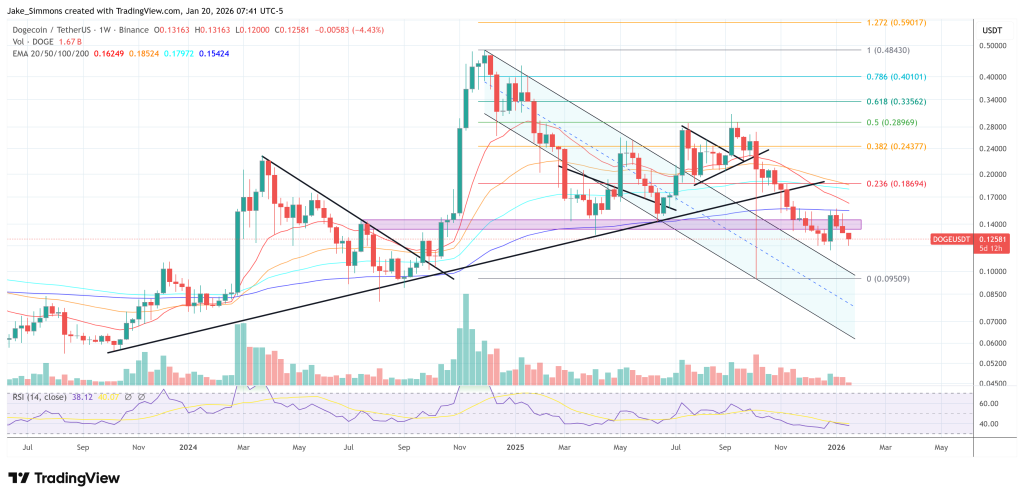
While neither post includes an explicit price target, the analyst said in early December that he expects Dogecoin to reach $1.30 over the medium term, citing a parallel channel top on the 3-day DOGE/USD chart.
At press time, DOGE traded at $0.12581.