Bitcoin’s Network Activity Reveals a Structural Shift: The New Story Unfolding

Bitcoin isn't just moving—it's morphing. Forget the price charts for a second. The real action is happening under the hood, where network activity paints a picture of a fundamental transformation.
The Quiet Revolution in the Ledger
Transactions are telling a new tale. It's not just about volume or velocity anymore. The patterns have shifted, signaling a deeper change in who's using Bitcoin and, more importantly, why. The network's pulse points to adoption that looks less like speculation and more like infrastructure.
Beyond the Speculative Frenzy
This isn't your 2017 hype cycle. The data suggests a maturation—a move away from purely momentum-driven flows. New addresses, settlement patterns, and fee dynamics all hint at a base being built, one that might just outlast the next wave of manic traders chasing the ghost of past all-time highs. Because nothing says 'mature asset class' like wild volatility propped up by narratives, right?
A Foundation for What Comes Next
This structural shift cuts both ways. It builds resilience but also raises the stakes. As the network's story evolves from digital gold to something more systemic, its next chapter won't be written by headlines—it'll be coded into the chain itself.
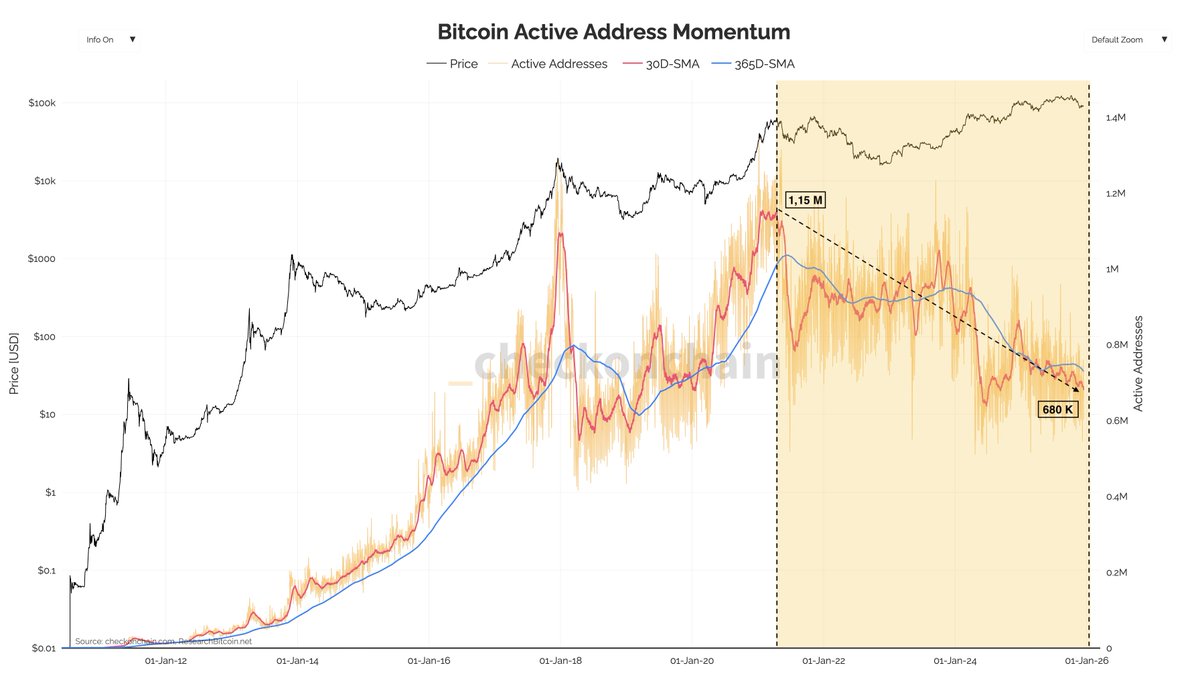
Active Addresses Signal A Structural Shift In The Market
The analysis suggests that despite Bitcoin’s strong price performance since 2022, on-chain participation continues to deteriorate. Active addresses are once again approaching the lowest levels observed during this cycle, highlighting a growing disconnect between price action and network activity. At the peak in April 2021, Bitcoin recorded roughly 1.15 million active addresses. Today, that figure has nearly halved, sitting NEAR 680,000, a contraction that cannot be ignored.
This decline is difficult to attribute to a single cause. Instead, it likely reflects a combination of structural changes in how Bitcoin is held and accessed. One contributing factor appears to be the rise in inactive addresses. While precise classification criteria vary, the broader trend points toward a stronger long-term holding mentality, where coins remain dormant rather than actively transacted on-chain. This behavior reduces visible network activity without necessarily implying bearish conviction.
At the same time, a portion of market participants may have shifted away from direct on-chain usage altogether. Centralized exchanges, custodial platforms, and financial products such as ETFs offer exposure to Bitcoin without requiring on-chain interaction. As a result, demand for block space declines even as capital allocation to Bitcoin remains significant.
Taken together, the sustained drop in active addresses suggests Bitcoin’s market structure is evolving. The network is becoming less retail-driven and more concentrated, reinforcing the idea that traditional cycle metrics may be losing some of their explanatory power in this environment.
Bitcoin Price Tests Long-Term Support as Structure Weakens
Bitcoin continues to trade under pressure, with the chart highlighting a clear deterioration in market structure. After failing to sustain prices above the $100K–$110K zone earlier in the year, BTC has entered a corrective phase marked by lower highs and heavy selling momentum. The recent MOVE toward the $87K area places price directly on a critical demand zone, closely aligned with the rising long-term moving averages.

From a trend perspective, the loss of the short- and medium-term moving averages is significant. The blue and green averages have rolled over, acting as dynamic resistance rather than support, reinforcing the bearish bias.
Price is now hovering just above the red long-term moving average, a level that has historically defined the boundary between bull market corrections and deeper bearish transitions. A clean breakdown below this zone WOULD materially increase downside risk toward the low-$80K region.
Volume behavior adds further context. Selling pressure expanded notably during the sharp drawdown from the highs, while recent bounce attempts have occurred on comparatively weaker volume. This suggests that dip-buying interest remains cautious rather than aggressive. Structurally, the market appears to be consolidating after distribution, not building a strong base yet.
In the near term, holding the $85K–$88K range is crucial. A failure to defend this area would confirm a broader trend shift, while reclaiming the $95K–$100K region is required to neutralize the current bearish structure.
Featured image from ChatGPT, chart from TradingView.com
