Bitcoin Poised to Retest $85,000 - Here’s What’s Fueling the Next Surge

Bitcoin's chart is flashing a familiar signal—one that traders haven't seen since the last major rally. The stage is set for a dramatic return to the $85,000 price zone, and the catalysts are lining up.
The Liquidity Magnet
Markets have a memory. That $85,000 level isn't just a random number; it's a massive pool of untapped liquidity left behind from previous trading. Major players are now positioning themselves to capture it, creating a powerful gravitational pull on the price.
Technical Alignment
Key momentum indicators are converging in a pattern that historically precedes significant upward moves. Resistance levels are weakening, while support has solidified at a much higher base than analysts predicted just months ago.
The Macro Whisper
Beyond the charts, a subtle shift in the broader financial landscape is at play. Traditional markets are showing cracks, pushing institutional capital to seek alternatives—a classic narrative, but one that still moves billions. Some call it a hedge; others call it the only game left in a zero-yield world propped up by central bank promises.
The path to $85,000 is clearing. Whether it's a brief retest or a launchpad for new highs depends on whether the old Wall Street guard finally understands the rules of a game they didn't invent.
Bitcoin Historical Data Reveals Recurring Monthly 8% Price Decline
In an X post on December 12, KillaXBT outlines a cautious market insight that suggests Bitcoin is headed for a price pullback. According to the renowned analyst, the premier cryptocurrency has consistently recorded an 8% price decline after the 14th day of the last five months. KillaXBT describes this observation as the 14th Pivot, which now holds important implications for Bitcoin in the short term. Since hitting a price bottom of $80,000 in late November, BTC has formed an ascending channel, recording a steady series of higher lows and higher highs.
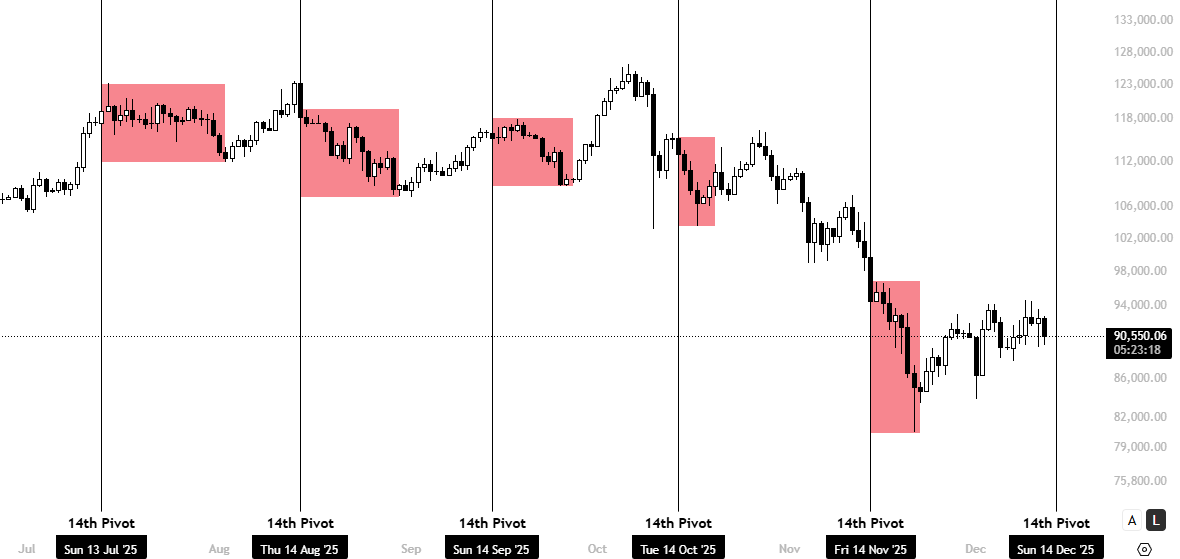
However, KillaXBT’s projection is expected to break this channel, potentially halting the nascent uptrend. Going by the recurring price pattern, the analyst states bitcoin investors should anticipate a minimum 5% price decline after the 14th of December, hinting at a potential retest of the 85,000-$86,000 price zone.
Given the asset’s broader bullish market structure, such a MOVE may represent nothing more than a short-term pullback. However, the prolonged correction seen earlier in Q4 has already set a precedent, leaving room for another phase of deeper downside should momentum weaken.
BTC To Bottom Below $50,000?
In another X post, KillaXBT shares more bearish projections of the Bitcoin market. This time, the seasoned analyst predicts the crypto market leader will hit a price bottom of $48,905 despite recent price gains. KillaXBT’s bottom target represents Bitcoin’s price as of the approval of the BlackRock IBIT ETF, alongside 11 other Bitcoin Spot ETFs in January 2024. This projection is likely due to the common rationale that the present bullish run has been heavily supported by institutional inflows.
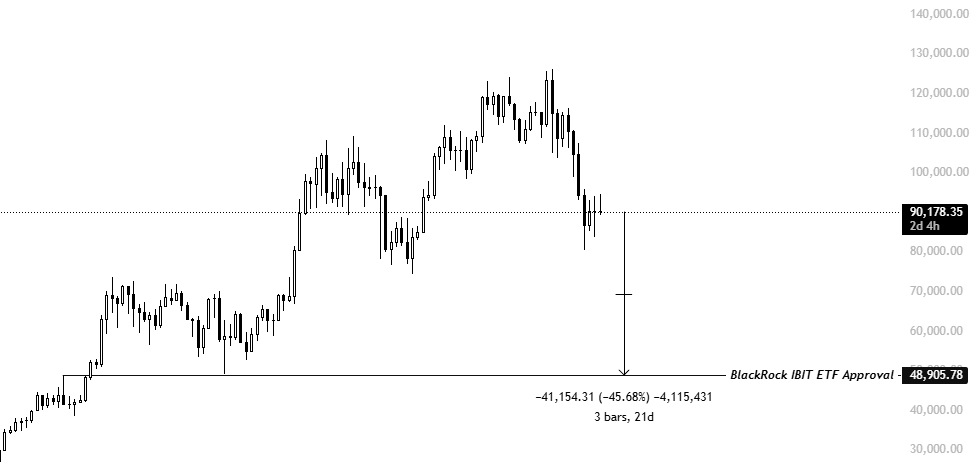
Notably, the Bitcoin Spot ETFs have been central to these institutional inflows, boasting total net assets of $119.18 billion. The BlackRock IBIT holds over half of this traction as the undisputed market leader with $71.03 billion in net assets and $62.68 billion in cumulative net inflows.
If Bitcoin were to return to its pre-ETF approval price levels, it would imply an estimated 46% decline from current market prices. Such a move would likely signal a sharp reversal in institutional positioning, suggesting that sustained ETF outflows, rather than retail capitulation, could emerge as the primary catalyst for a renewed crypto winter.
At press time, Bitcoin continues to trade at $90,348, reflecting a 2.18% decline.
Featured image from Pexels, chart from Tradingview
