Solana Bulls Smash Through $200 Barrier—But Historical Data Warns Correction Could Be Imminent

Solana’s rally just hit a major milestone—reclaiming the $200 level. But if past cycles are any indication, this surge might be setting the stage for a pullback.
Patterns Don’t Lie
Historical performance suggests Solana has a habit of retracing after breaching key psychological barriers. The $200 mark has repeatedly acted as both a launchpad and a ceiling.
Market Psychology at Play
Traders are chasing momentum, yet seasoned players are watching for signs of exhaustion. Every pump invites profit-taking—especially in an asset as volatile as SOL.
Macro Whispers
Broader crypto markets look shaky. Bitcoin’s struggling for direction, and altcoins often follow BTC’s lead, not the other way around. When liquidity tightens, alts bleed first.
So, is this a breakout or a bull trap? Time will tell. But if history’s any guide—and in crypto, it’s the only thing fund managers pretend to care about until it contradicts their thesis—tread carefully.
Long-Term Holders Sit on Elevated Gains
The first warning sign comes from the Net Unrealized Profit/Loss (NUPL) of long-term holders. This metric tracks whether investors are sitting on paper profits or losses. When NUPL is high, it suggests holders may be tempted to lock in gains.
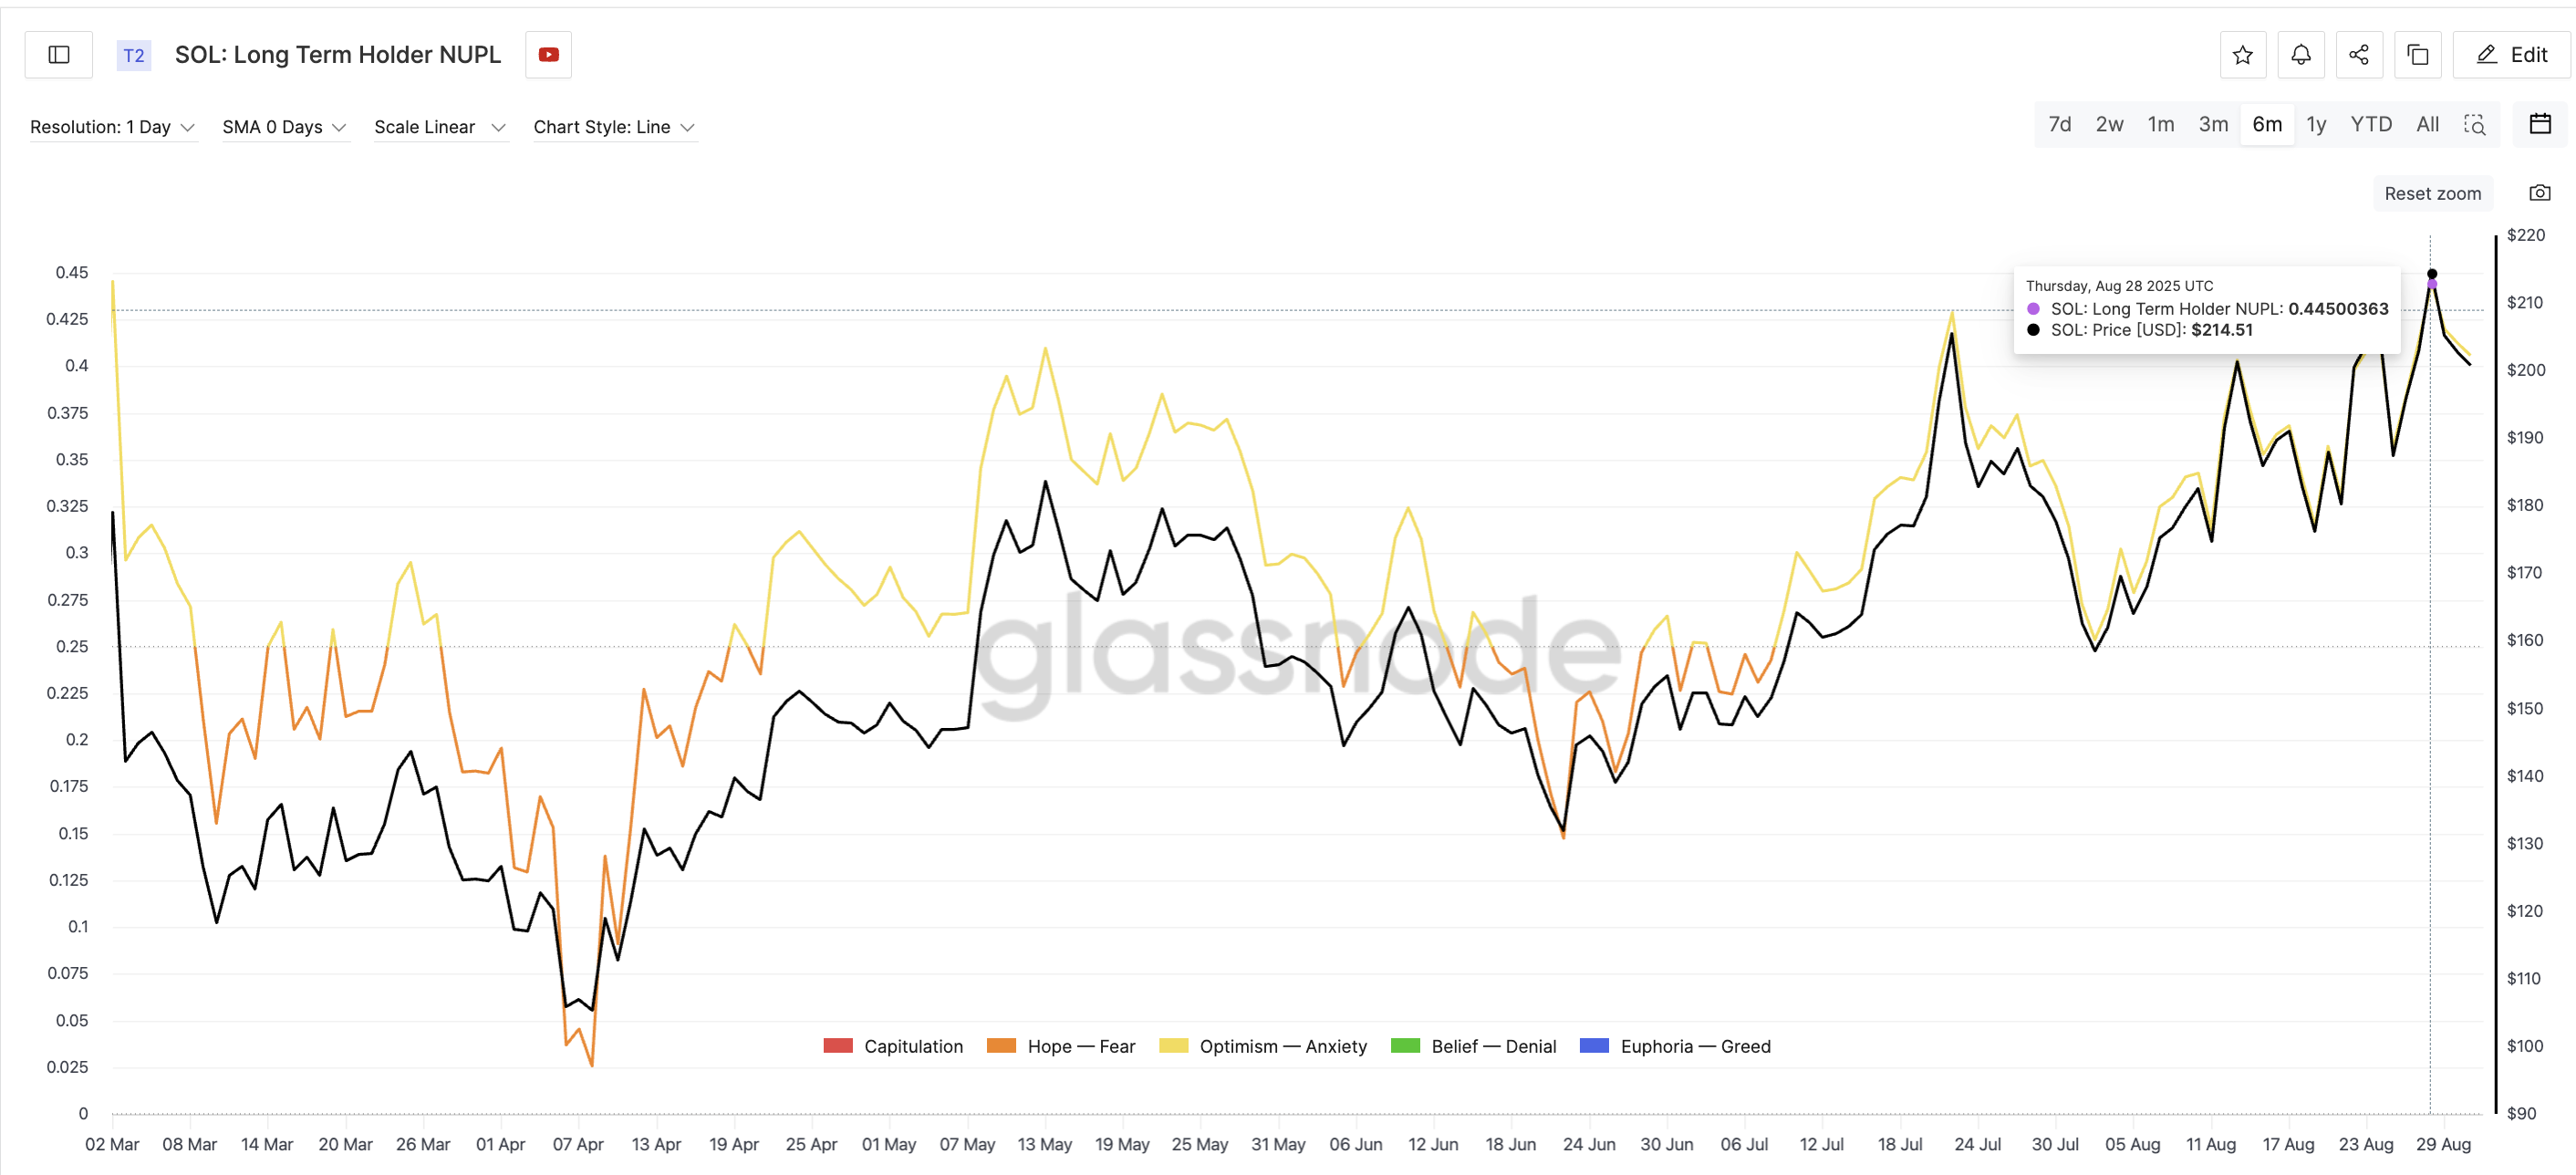
On August 28, Solana’s long-term holder NUPL touched 0.44, its highest in six months and close to the March 2 peak of 0.4457. That earlier spike was followed by a sharp drop when Solana price fell from $179 to $105 in less than two weeks, a 41% correction. A more recent example came on July 22, when a 23% slide followed a NUPL high.
The latest NUPL reading has eased slightly to 0.40, but it is still elevated compared to recent months.
: Want more token insights like this? Sign up for Editor Harsh Notariya’s Daily crypto Newsletter here.
Coin Days Destroyed Validates Profit-Taking
This concern is also visible in the Coin Days Destroyed (CDD) metric, which tracks how many older coins are moving on-chain, possibly hinting at profit-taking. Each time CDD spiked over the past six months, Solana’s price corrected sharply soon after.
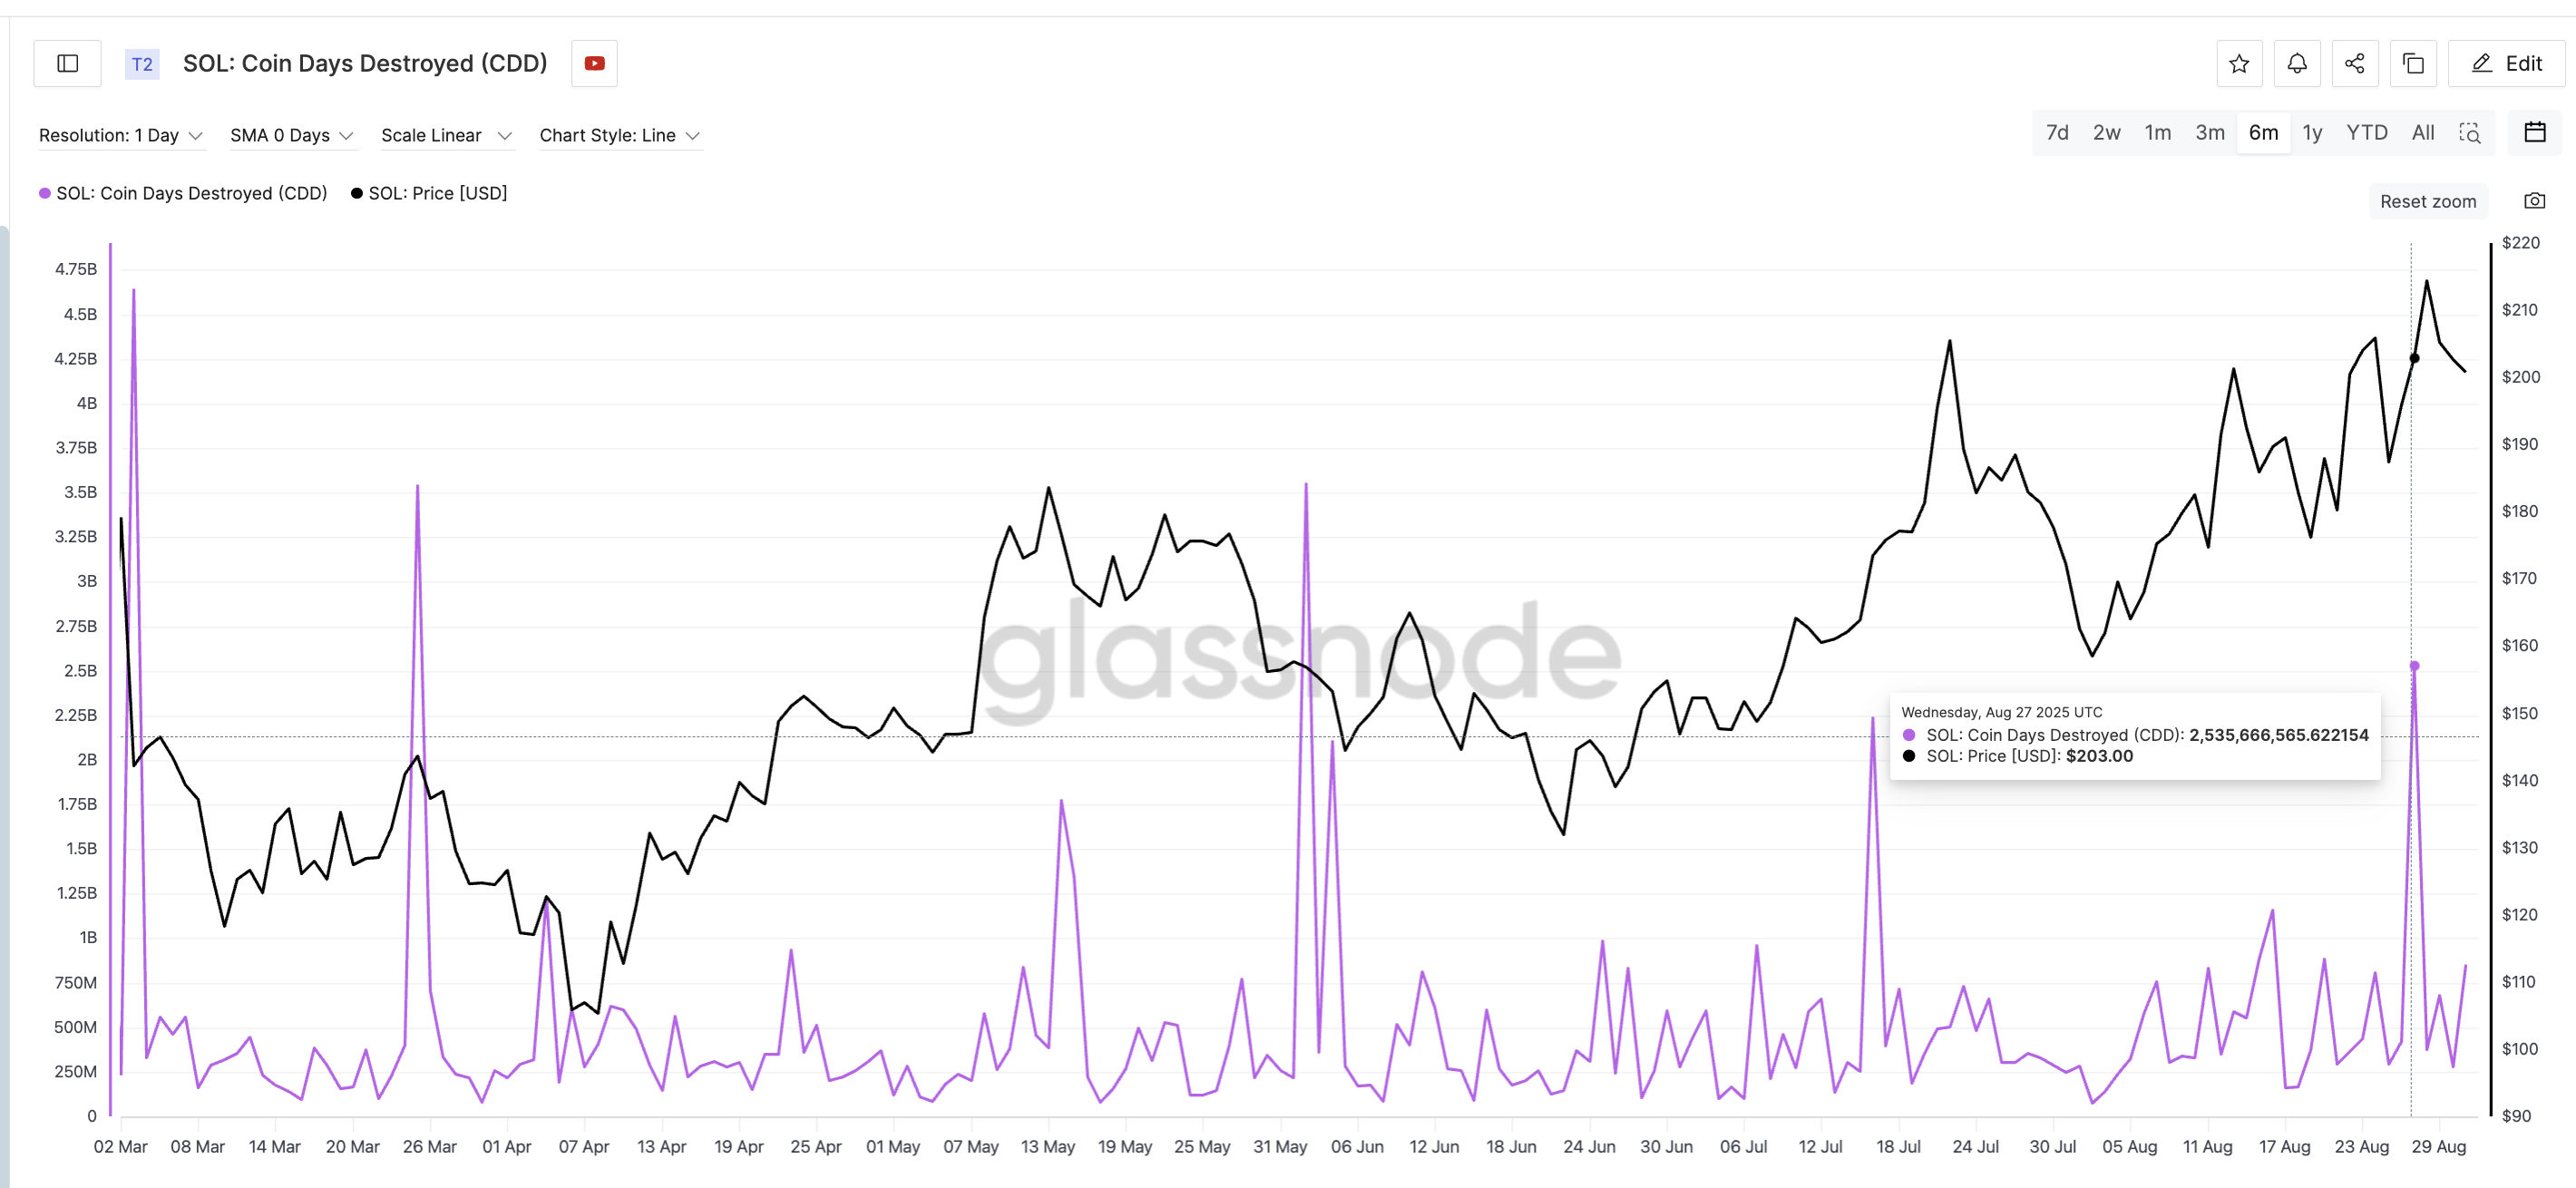
For example, on March 3, the solana price fell from $142 to $118, a 17% drop. Another spike on March 25 saw the price slip from $143 to $105. Even when the move was delayed, like after July 16, the eventual correction from $205 to $158 showed how strong the signal can be.
The latest spike came on August 27, when solana traded near $203. While the correction has only just started, the pattern suggests long-term holders may already be selling into strength, validating what the NUPL data hinted at.
Key Solana Price Levels Confirm the Risk
The technical chart completes the picture. Solana is trading near $203, flipping the $201 resistance into temporary support. But the bullish case will only hold if a daily close stays above that level.
A dip below $196 or $191 WOULD tilt momentum bearish, and breaking $175 would confirm a deeper correction.
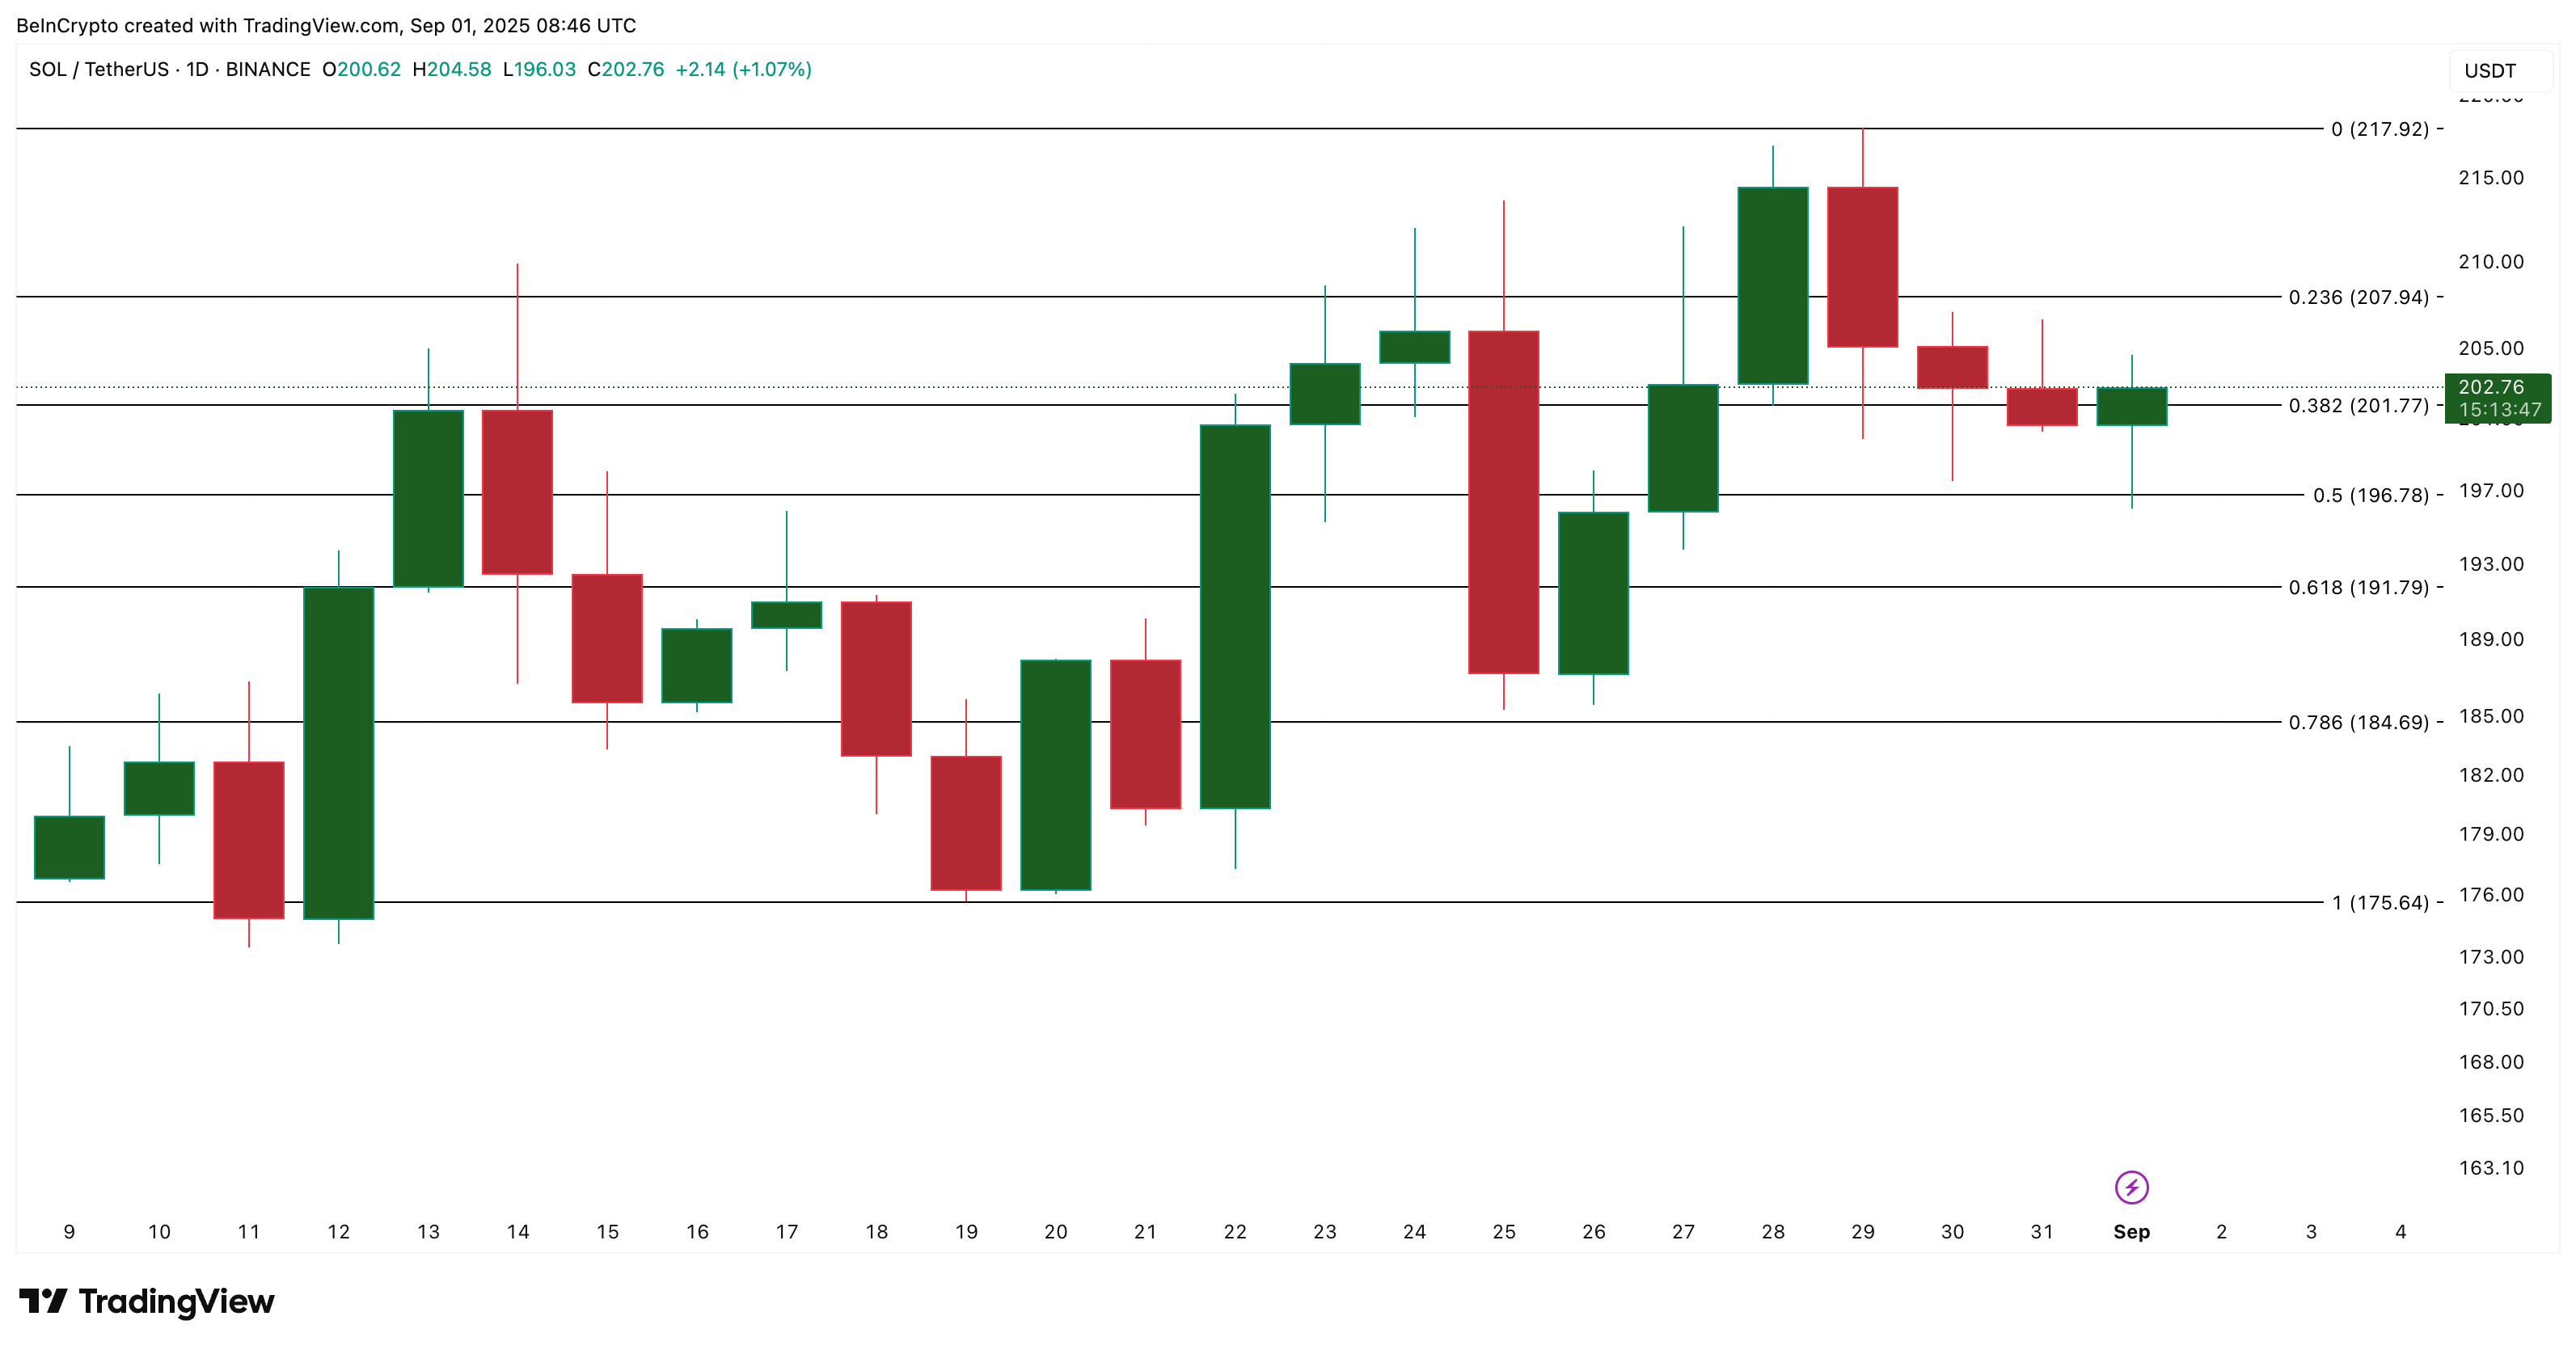
On the upside, bulls need to reclaim higher ground quickly, but with long-term holders sitting on gains and CDD showing coins moving, the risk of further downside remains in play.
However, the bearish trend would fizzle out if the Solana price manages to reclaim 207 cleanly, with a complete candle forming above that level. For now, the metrics suggest that the Solana price rebound above $200 may not hold without stronger support.
