Bitcoin Battles at $110K as Market Momentum Cools - Is This the Calm Before the Next Rally?
Bitcoin's push past $110,000 hits a wall as traders take profits across digital assets.
The pullback pattern
Market sentiment shifts from euphoria to caution as institutional flows slow and retail traders pause their buying spree. The $110,000 level becomes a psychological barrier that's proving tougher to crack than expected.
Trading volume tells the story
Spot trading drops 15% while derivatives activity remains elevated—classic signs of a market catching its breath rather than reversing trend. Meanwhile, traditional finance veterans whisper about 'overheated conditions' while quietly adding to their positions at these levels.
Every major crypto correction looks like the end until it becomes just another buying opportunity. The only thing more predictable than Bitcoin's volatility? Traditional investors underestimating its resilience.
BTC Futures Traders Retreat as Selloffs Continue
On-chain data shows that sell-side pressure continues to mount, threatening to push BTC below the psychological $110,000 threshold.
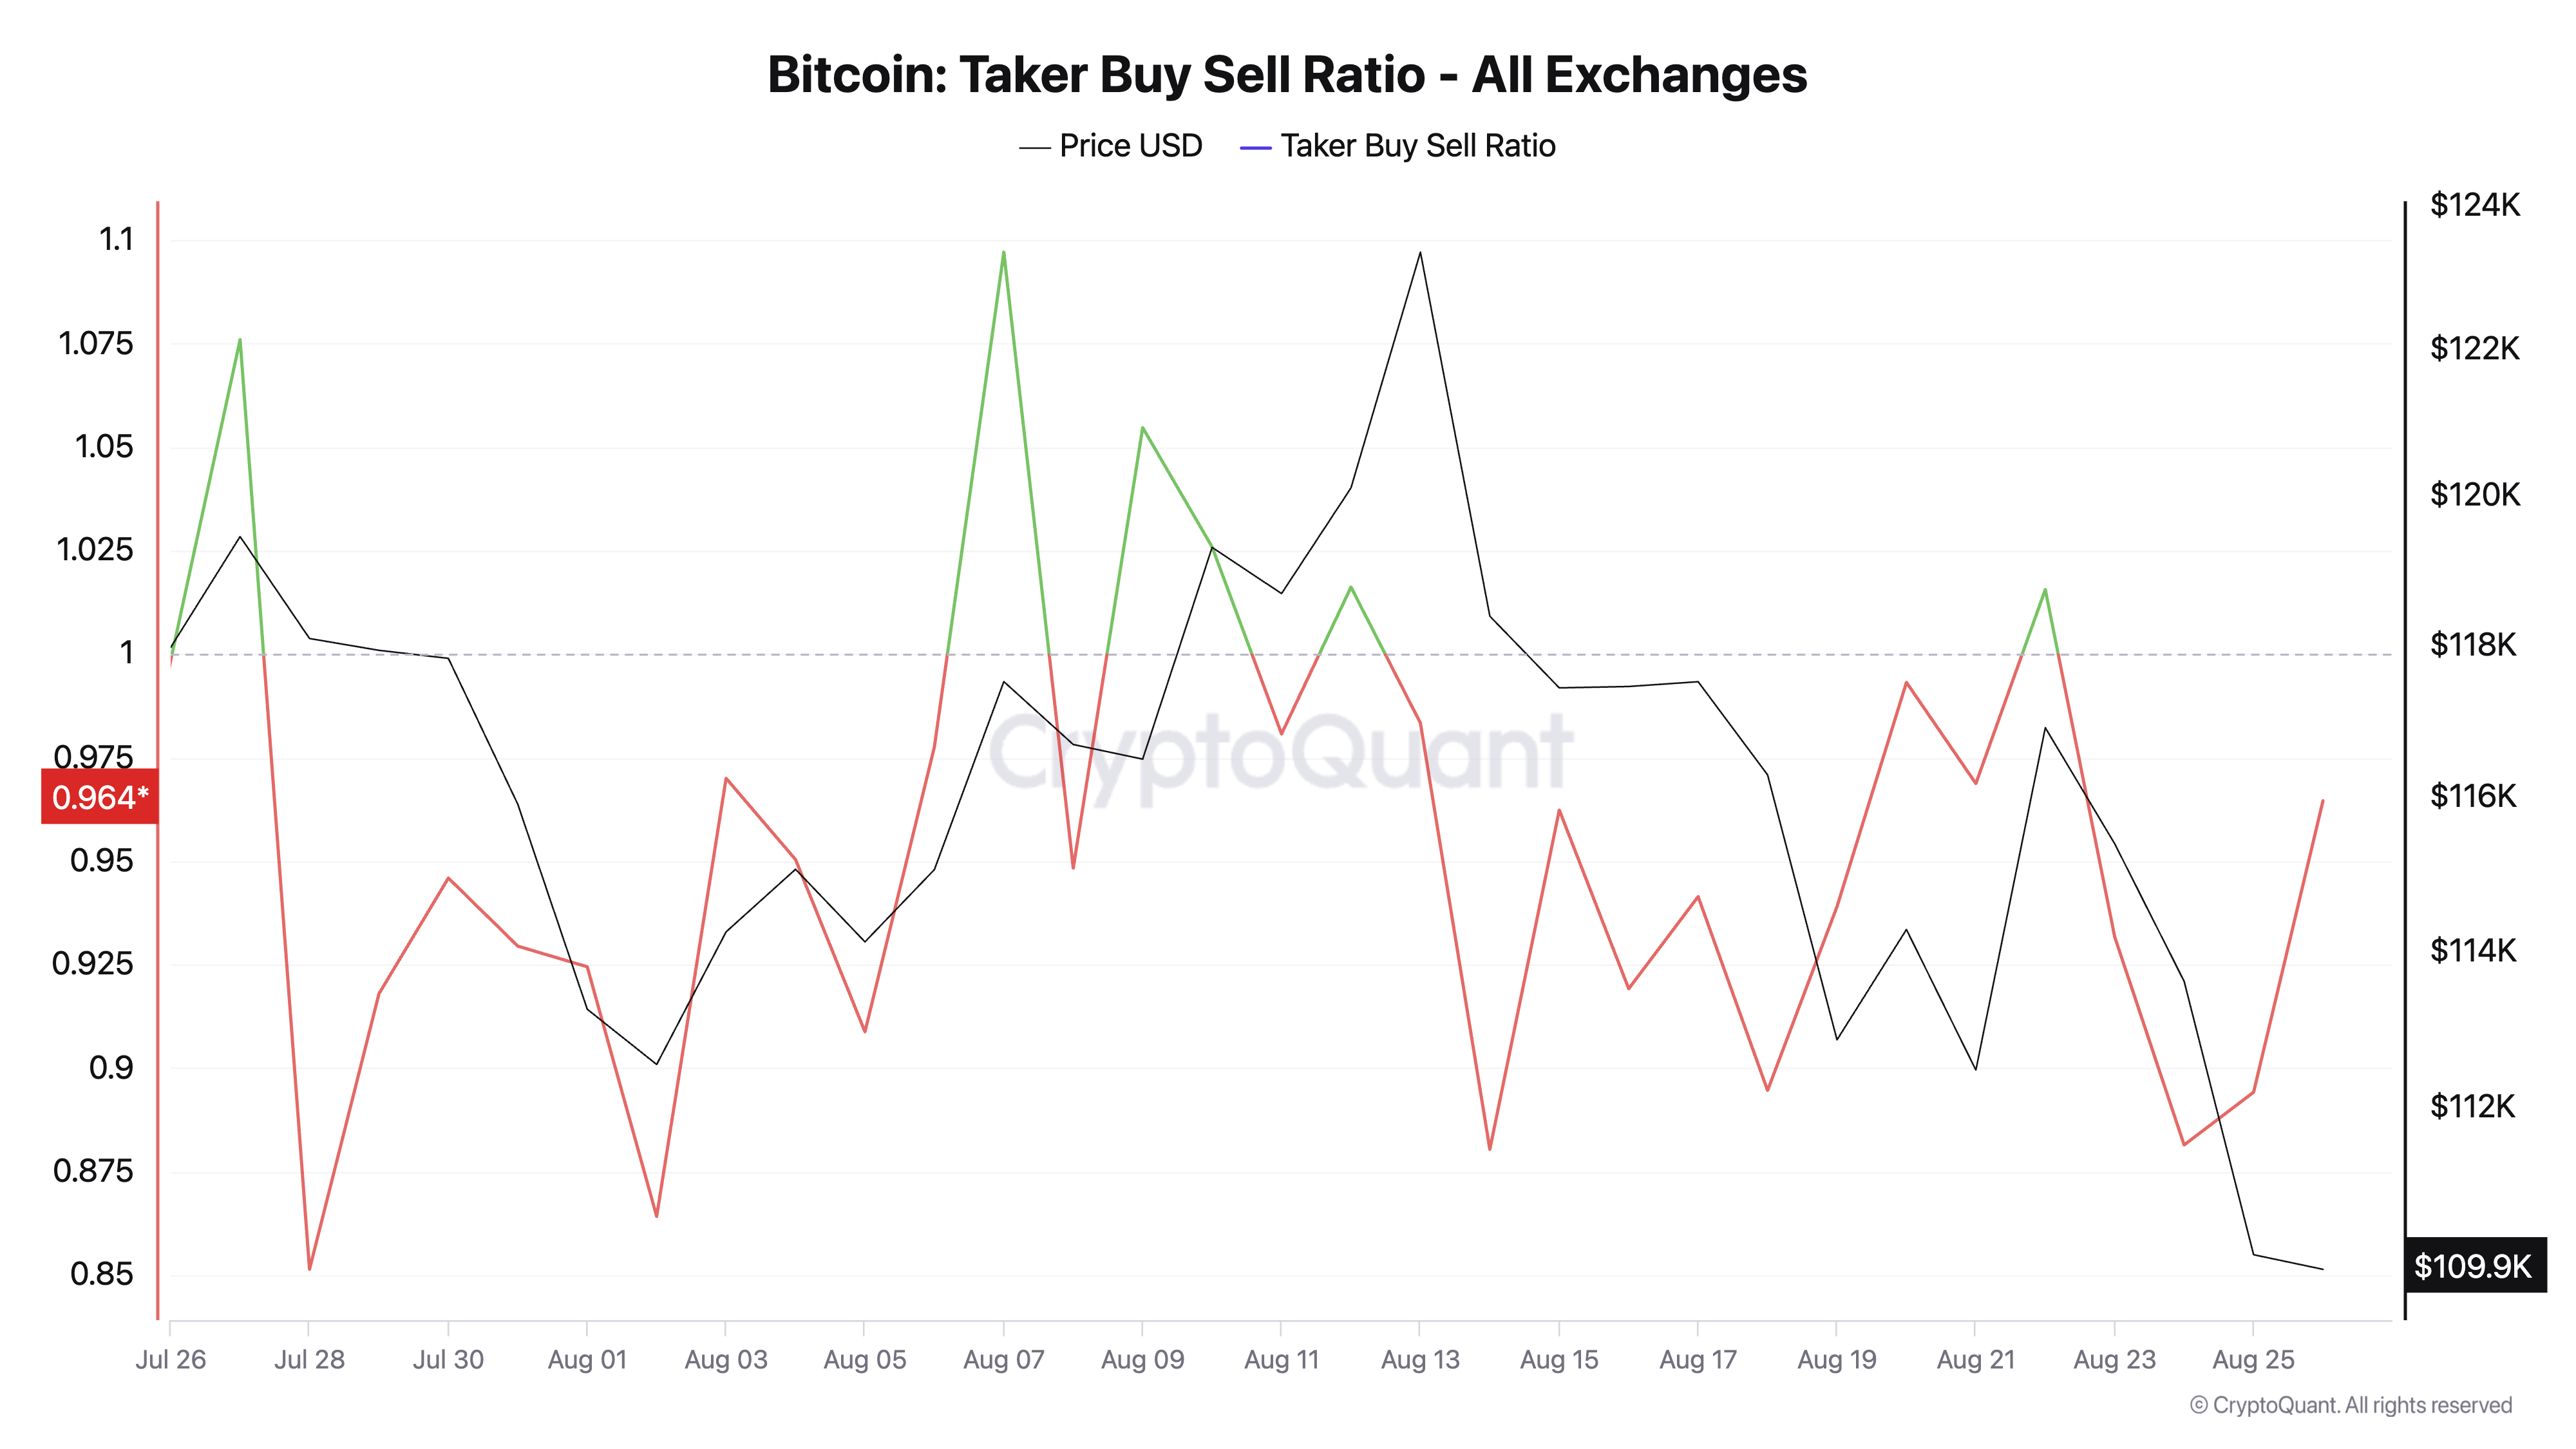
One of the most telling signs is BTC’s Taker-Buy Sell Ratio, which has been predominantly negative since July. At press time, it stands at 0.96 per CryptoQuant, indicating that sell orders dominate buy orders across the coin’s futures market.
: Want more token insights like this? Sign up for Editor Harsh Notariya’s Daily crypto Newsletter here.

BTC Taker Buy Sell Ratio. Source: CryptoQuant
An asset’s taker buy-sell ratio measures the ratio between the buy and sell volumes in its futures market. Values above one indicate more buy than sell volume, while values below one suggest that more futures traders are selling their holdings.
For BTC, this trend indicates that its futures traders are pulling back from aggressive bullish bets, adding to the pressure already weighing on the market. It shows a lack of conviction among derivatives traders that the king coin could see a notable near-term recovery.
Bitcoin Spot Traders Turn Sellers
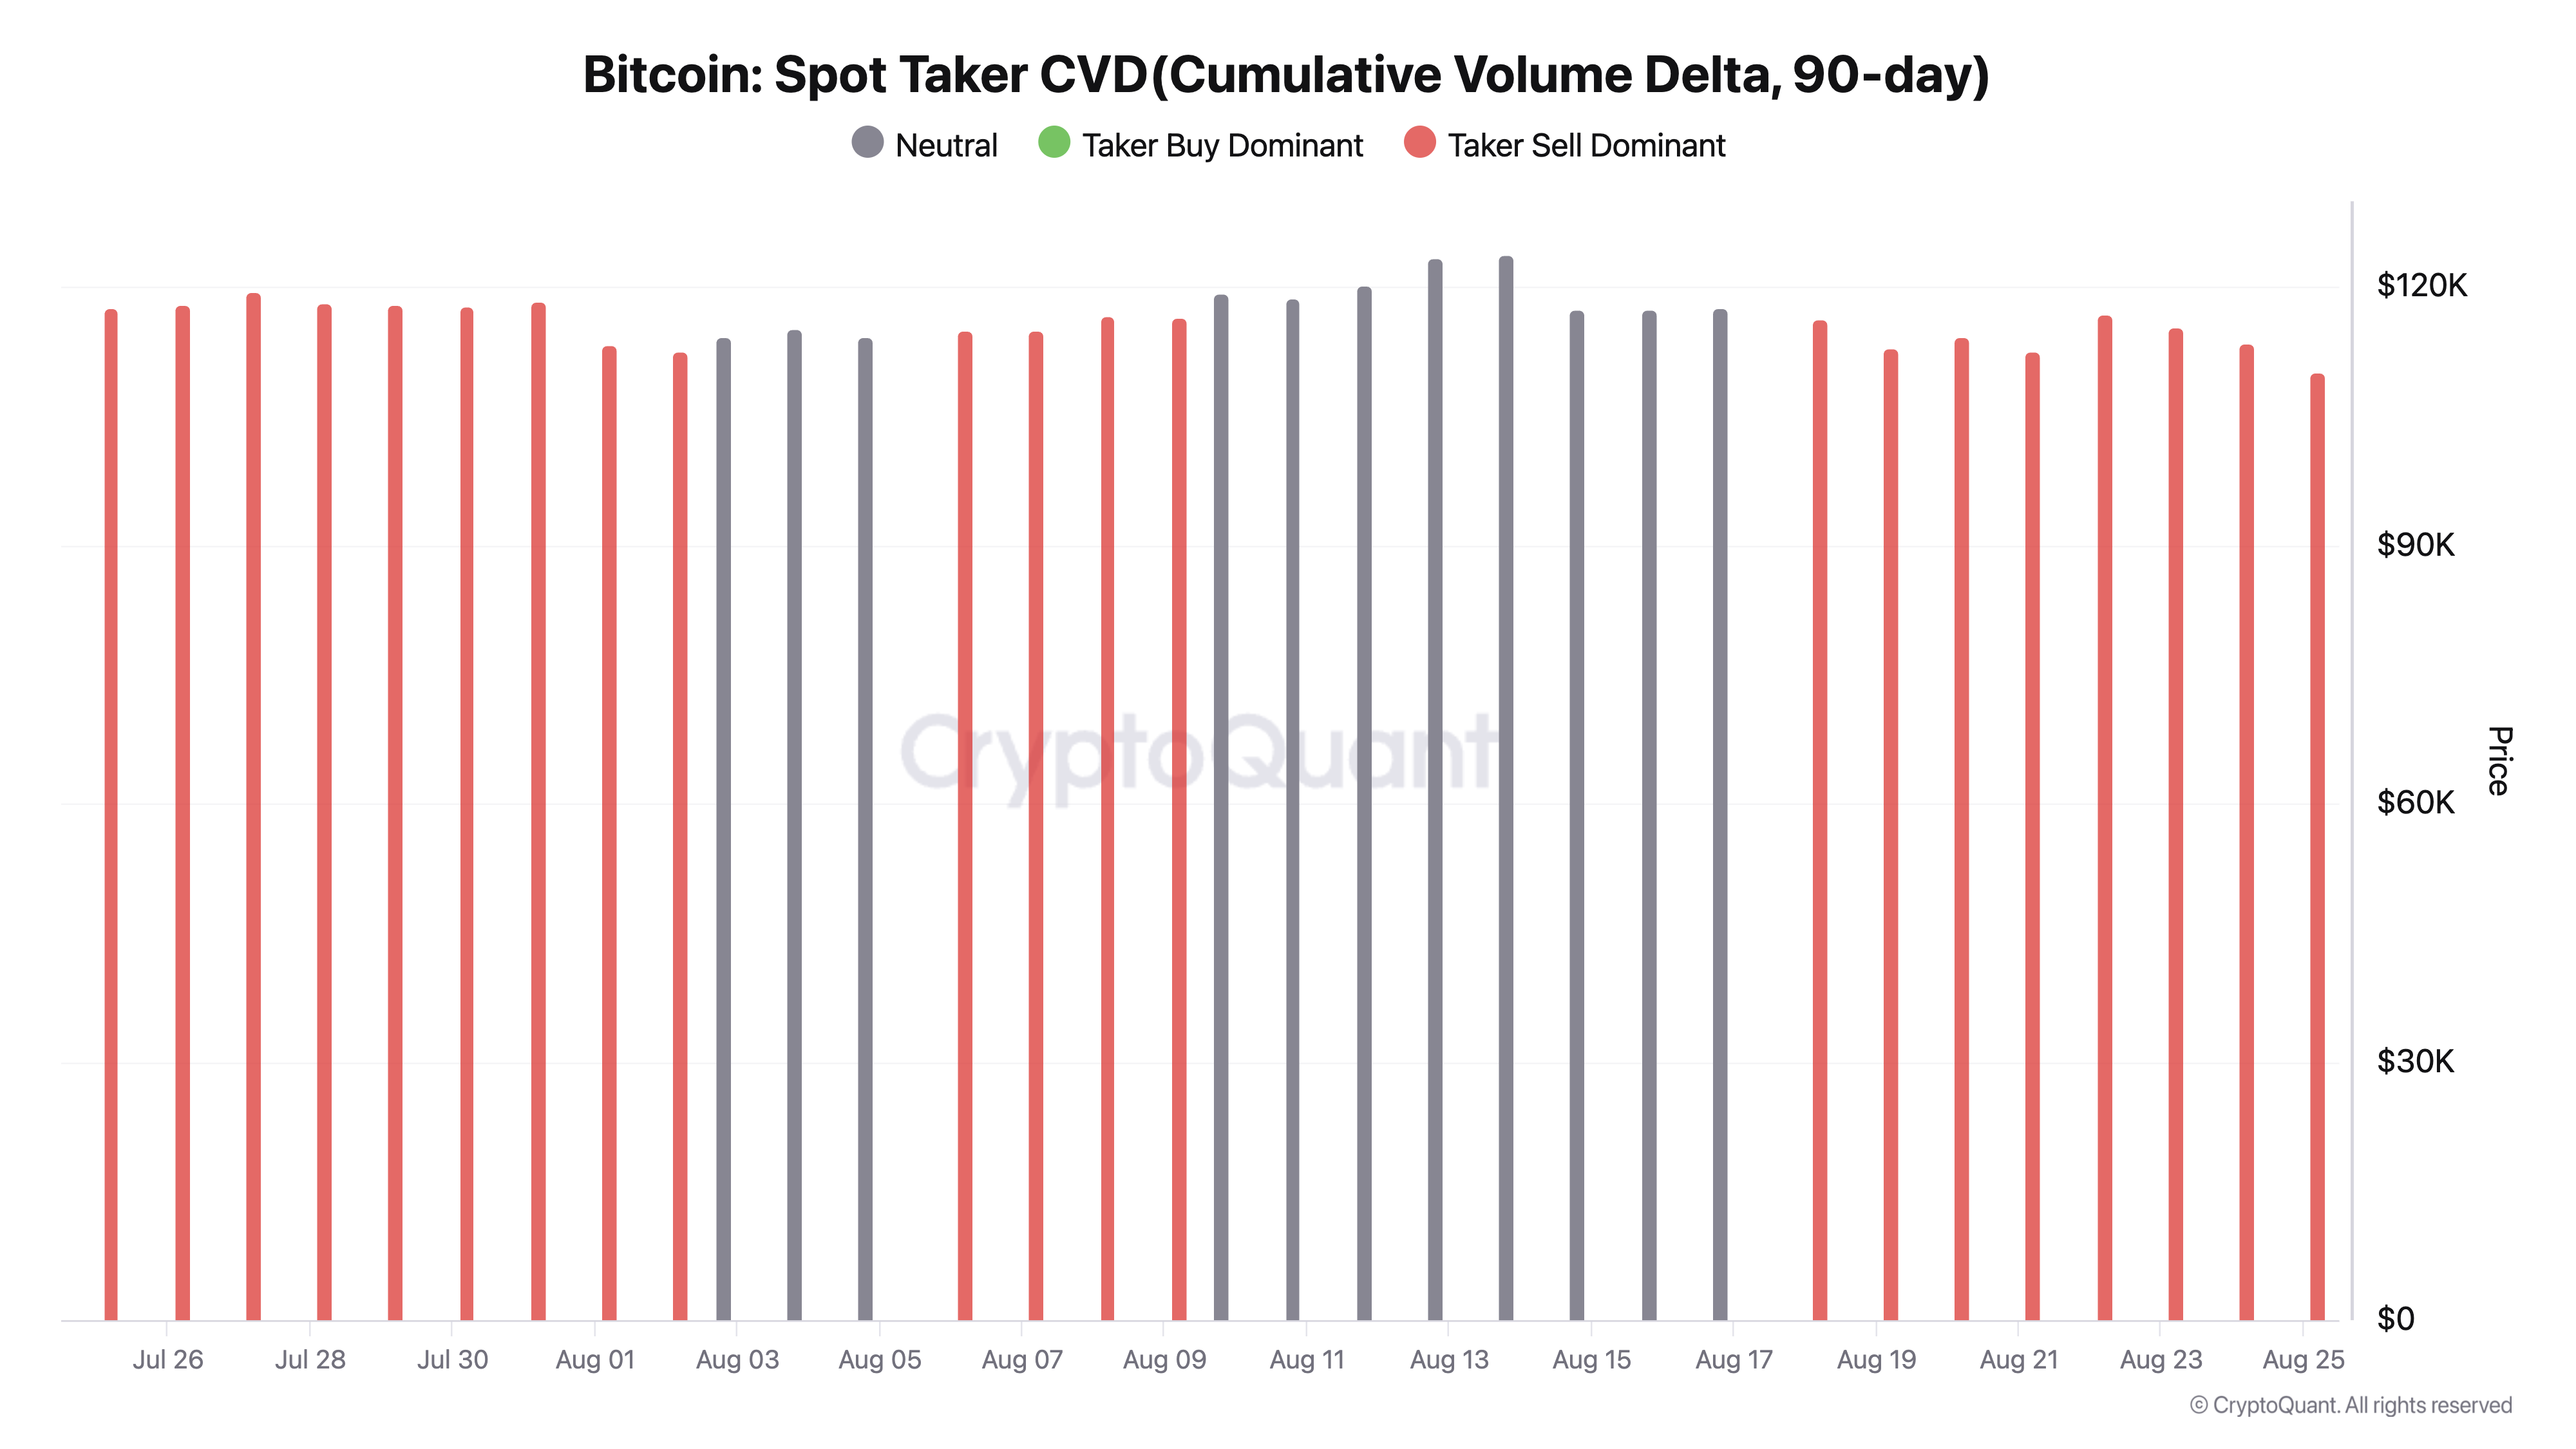
The trend is no different among spot market participants. Per CryptoQuant’s data, Bitcoin’s Spot Taker CVD (Cumulative Volume Delta, 90-day), which tracks net buying and selling activity in the spot market over a 90-day period, flipped from “neutral” on August 18.
Since then, it has consistently posted red bars, signaling that sellers are dominating spot market activity.

This shift into a taker-sell dominant phase for BTC reflects fading demand and weaker buy-side absorption of increasing supply. With spot traders increasingly offloading rather than accumulating, the imbalance heightens the risk of further downside.
$110,000 Support Under Siege Amid Fading Demand
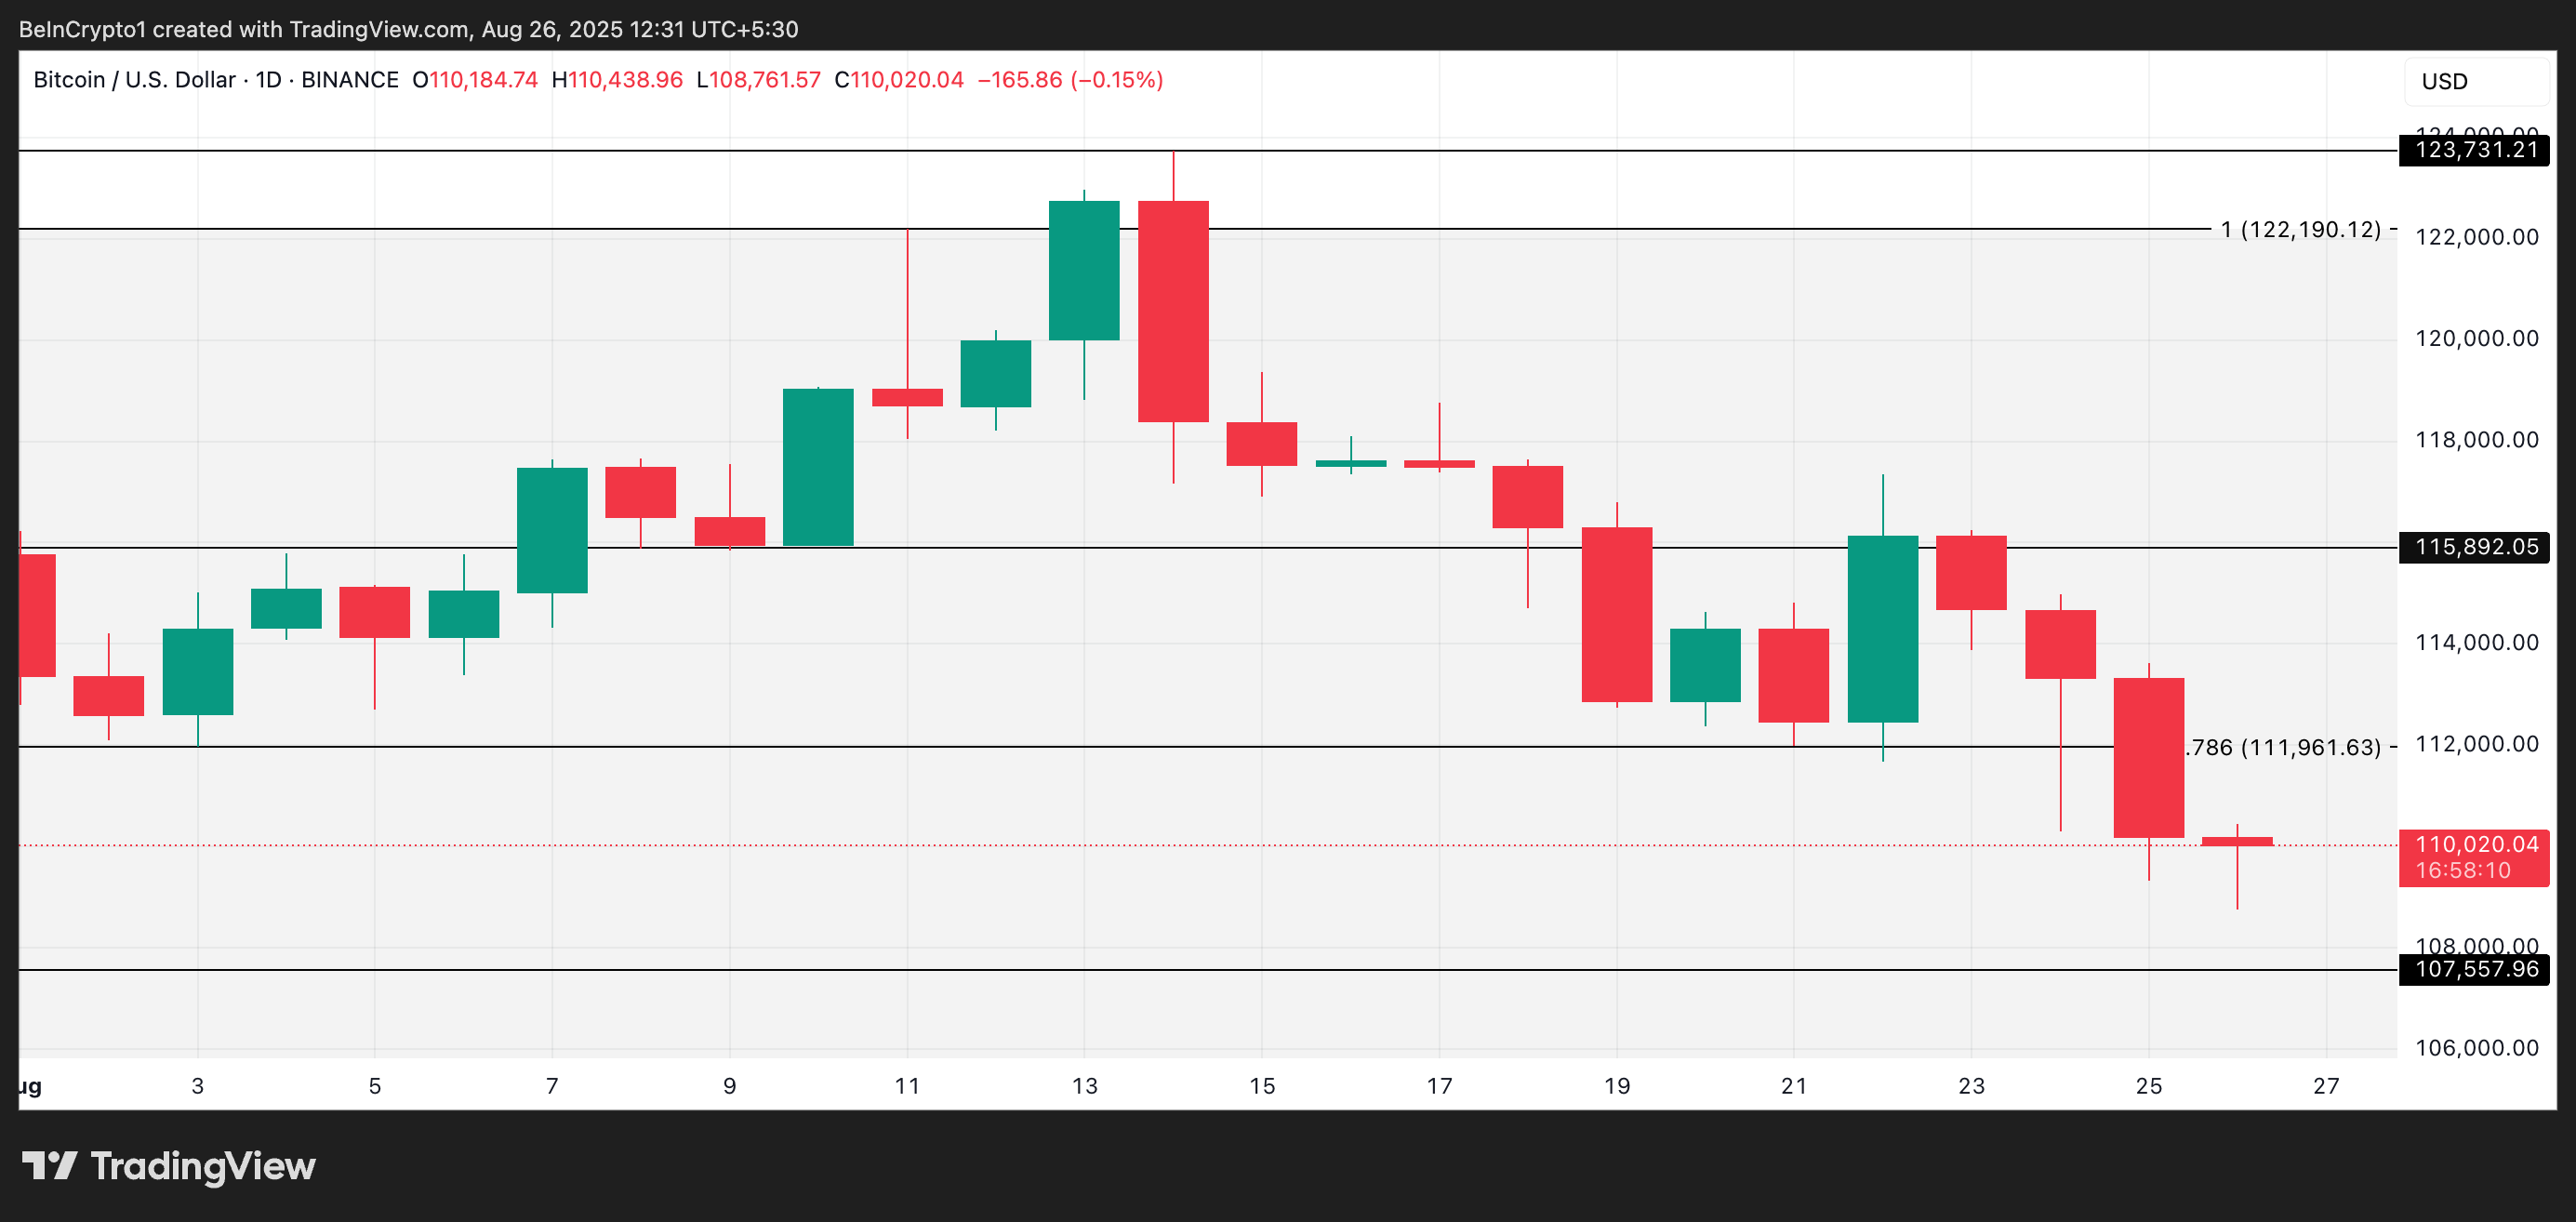
As demand thins across both spot and futures markets, leading coin BTC risks plunging below $110,000. In this scenario, the coin’s price could fall to $107,557, its next major support level.

However, if buyers regain dominance and drive a rally, they could drive BTC’s price to $111,961. A breach of this wall could trigger a MOVE to $115 892.

