HBAR’s Critical $0.20 Support at Risk—Month-Long Consolidation Pattern Breaking

Hedera's native token tests make-or-break level as bearish momentum builds.
Technical Breakdown
HBAR's stubborn range play finally shows cracks—thirty days of sideways action culminating in this decisive test. That $0.20 floor isn't just psychological; it's where institutional buyers previously stepped in. Break below here, and next support sits at $0.15.
Market Context
Whale movements spike as large holders take profits—classic 'sell the news' behavior after last month's enterprise partnership announcements. Trading volume jumps 40% on the downside, confirming this isn't just retail panic.
Outlook
Either HBAR holds and forms a double bottom—bullish divergence would suggest accumulation—or we're looking at a 25% drop to test 2025 lows. Smart money watches the $0.19-$0.21 zone like hawks; breach either side triggers the next major move.
Because nothing says 'decentralized future' like watching digital assets get whipped around by the same old support and resistance levels traders have used since the 1980s.
Hedera Bears Target Key Support
Readings from the HBAR/USD one-day chart show the altcoin trading within a horizontal channel. After July’s rally drove HBAR to a cycle peak of $0.30 on July 27, the token has since lost upward momentum and fallen into consolidation.
Since then, HBAR’s price action has moved mostly sideways, with a few unsuccessful attempts to break either above or below the channel. It has consistently faced resistance at $0.26 while holding support around $0.22, highlighting the market’s indecision.
: Want more token insights like this? Sign up for Editor Harsh Notariya’s Daily crypto Newsletter here.
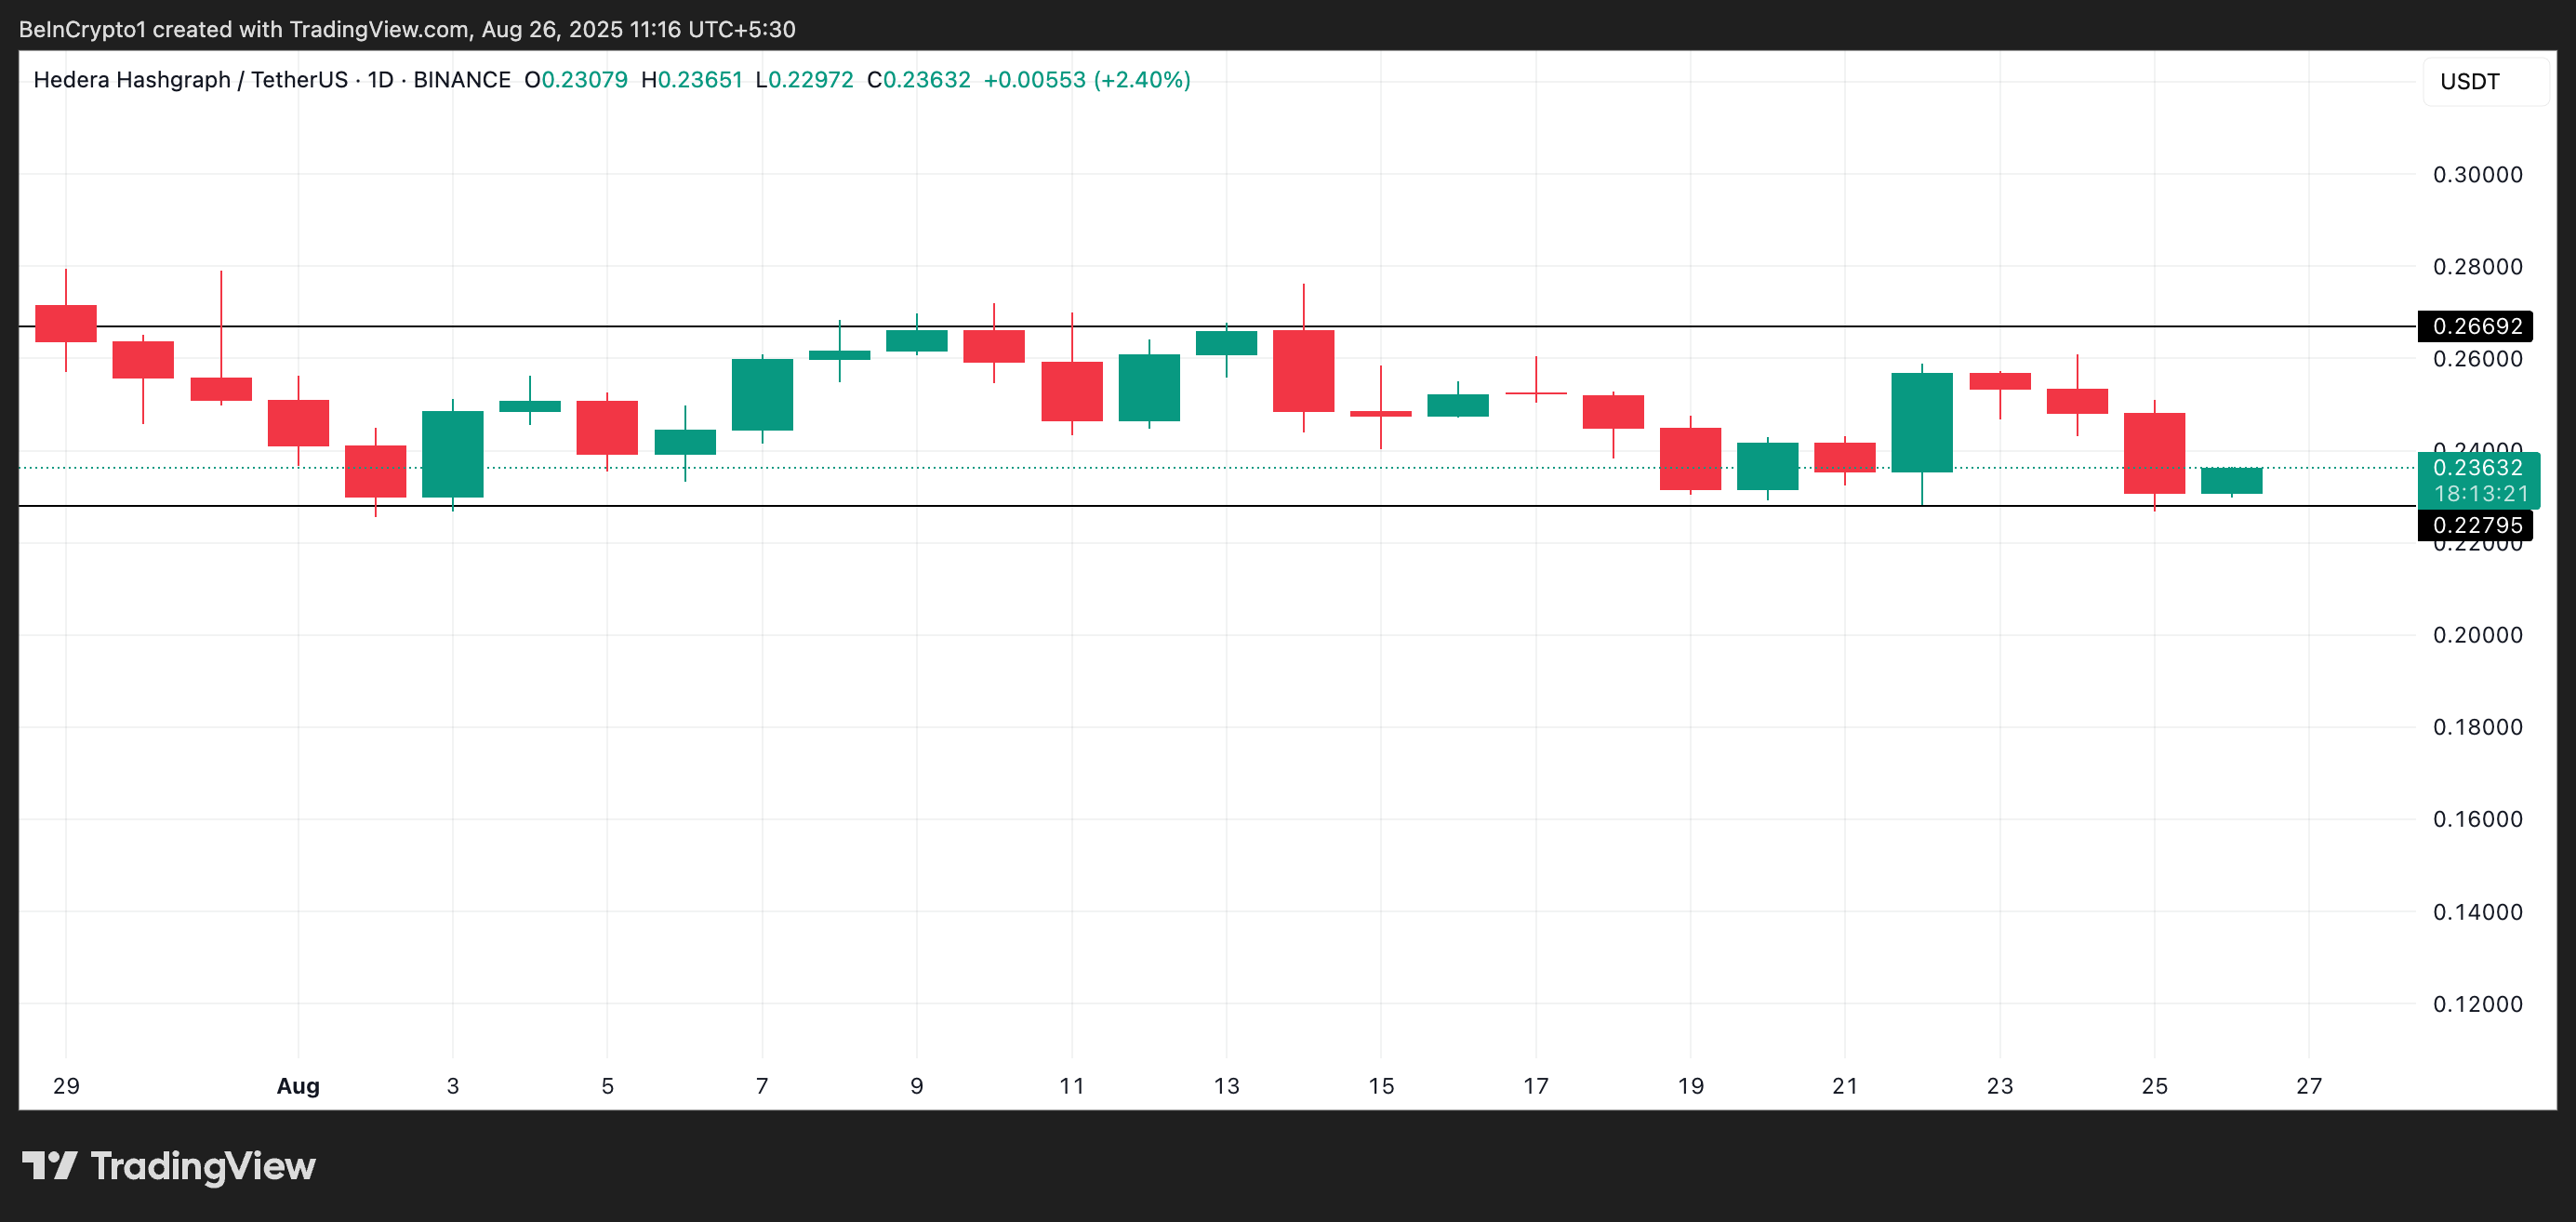
With on-chain and technical readings showing the bears gaining strength, HBAR may soon break below its $0.22 support level.
HBAR Futures Traders Bet on Breakdown
HBAR’s weighted funding rate has flipped negative for the first time in the past week, an indication that short positions are gaining traction and sell-side pressure is intensifying. As of this writing, it stands at -0.0016%.
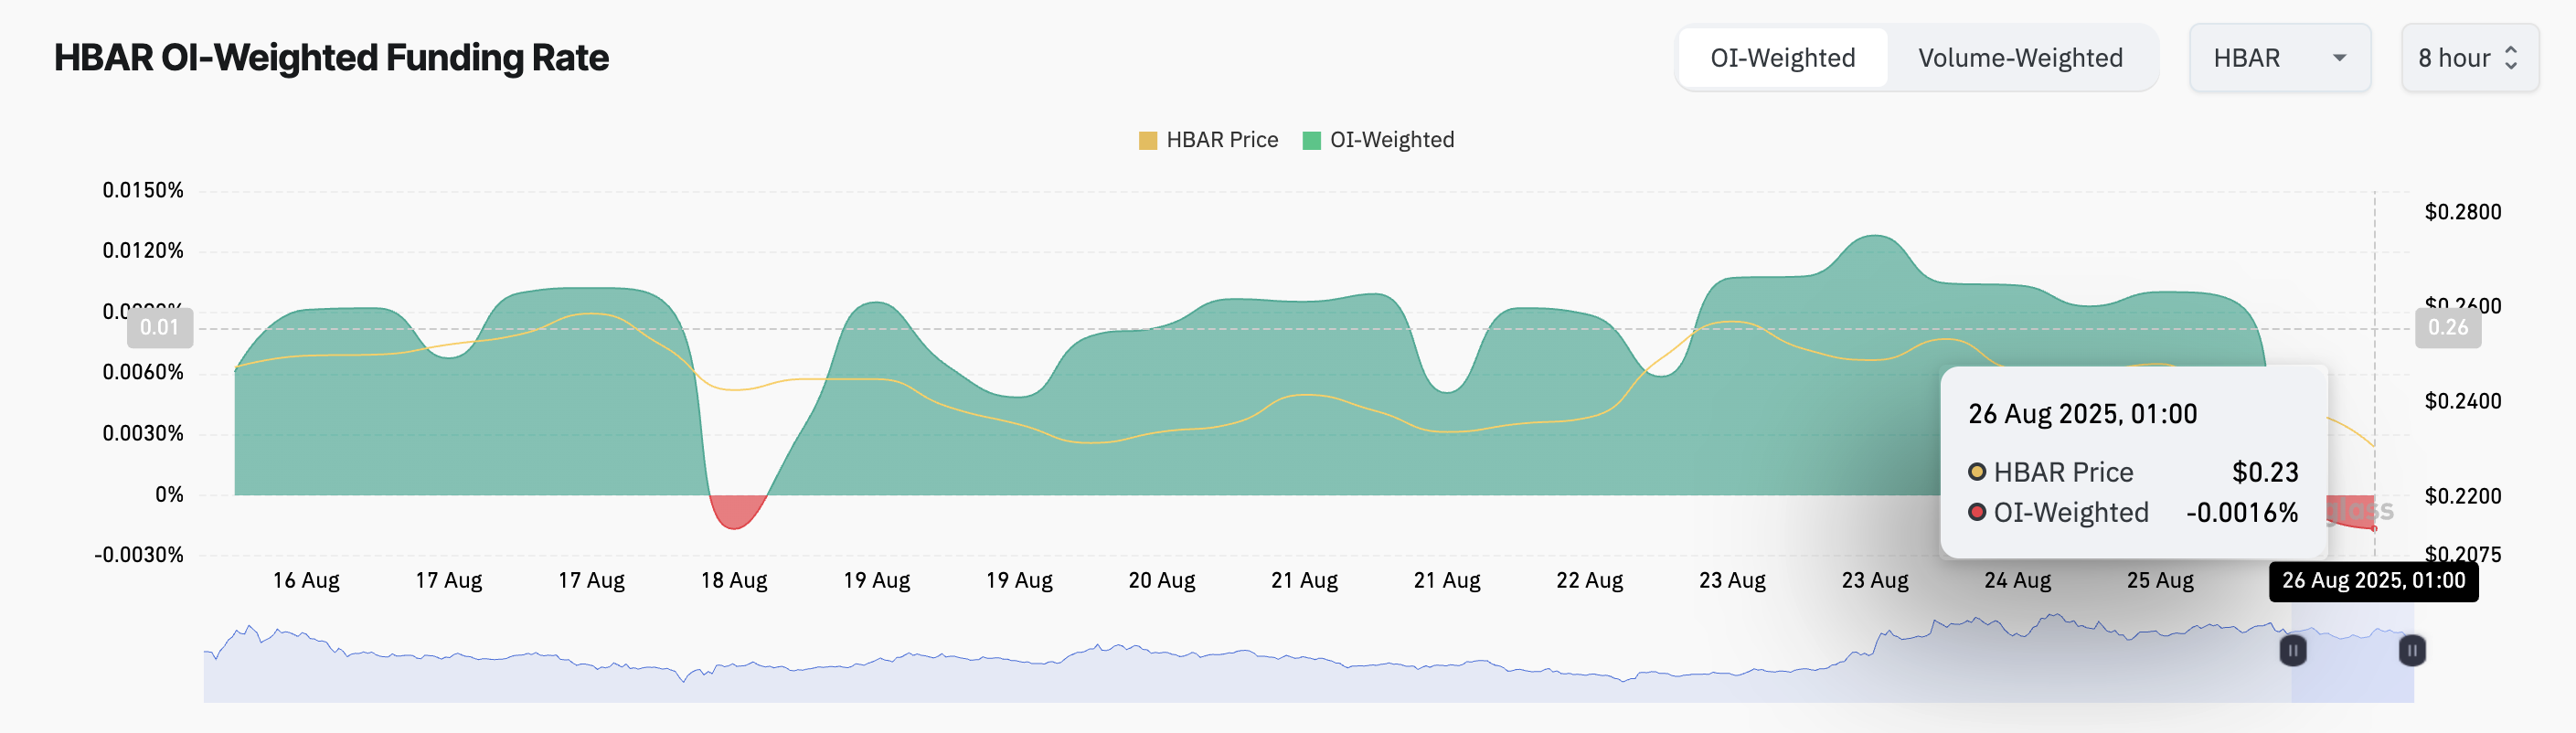
The funding rate is used in perpetual futures markets to keep contract prices aligned with the spot price. When an asset’s funding rate is positive, long traders are paying shorts, signaling bullish sentiment.
Conversely, a negative funding rate means short traders are paying longs, indicating that bearish bets dominate the market.
For HBAR, the negative flip in its funding rate shows that its futures traders are increasingly positioning for downside, worsening the risk of a breakdown below its current support zone.
Further, buy-side pressure from key traders has stalled, contributing to the downward pressure on HBAR. The token’s Smart Money Index (SMI), at 0.98 at press time, has plunged slowly since August 22, confirming that momentum is shifting in favor of the bears.
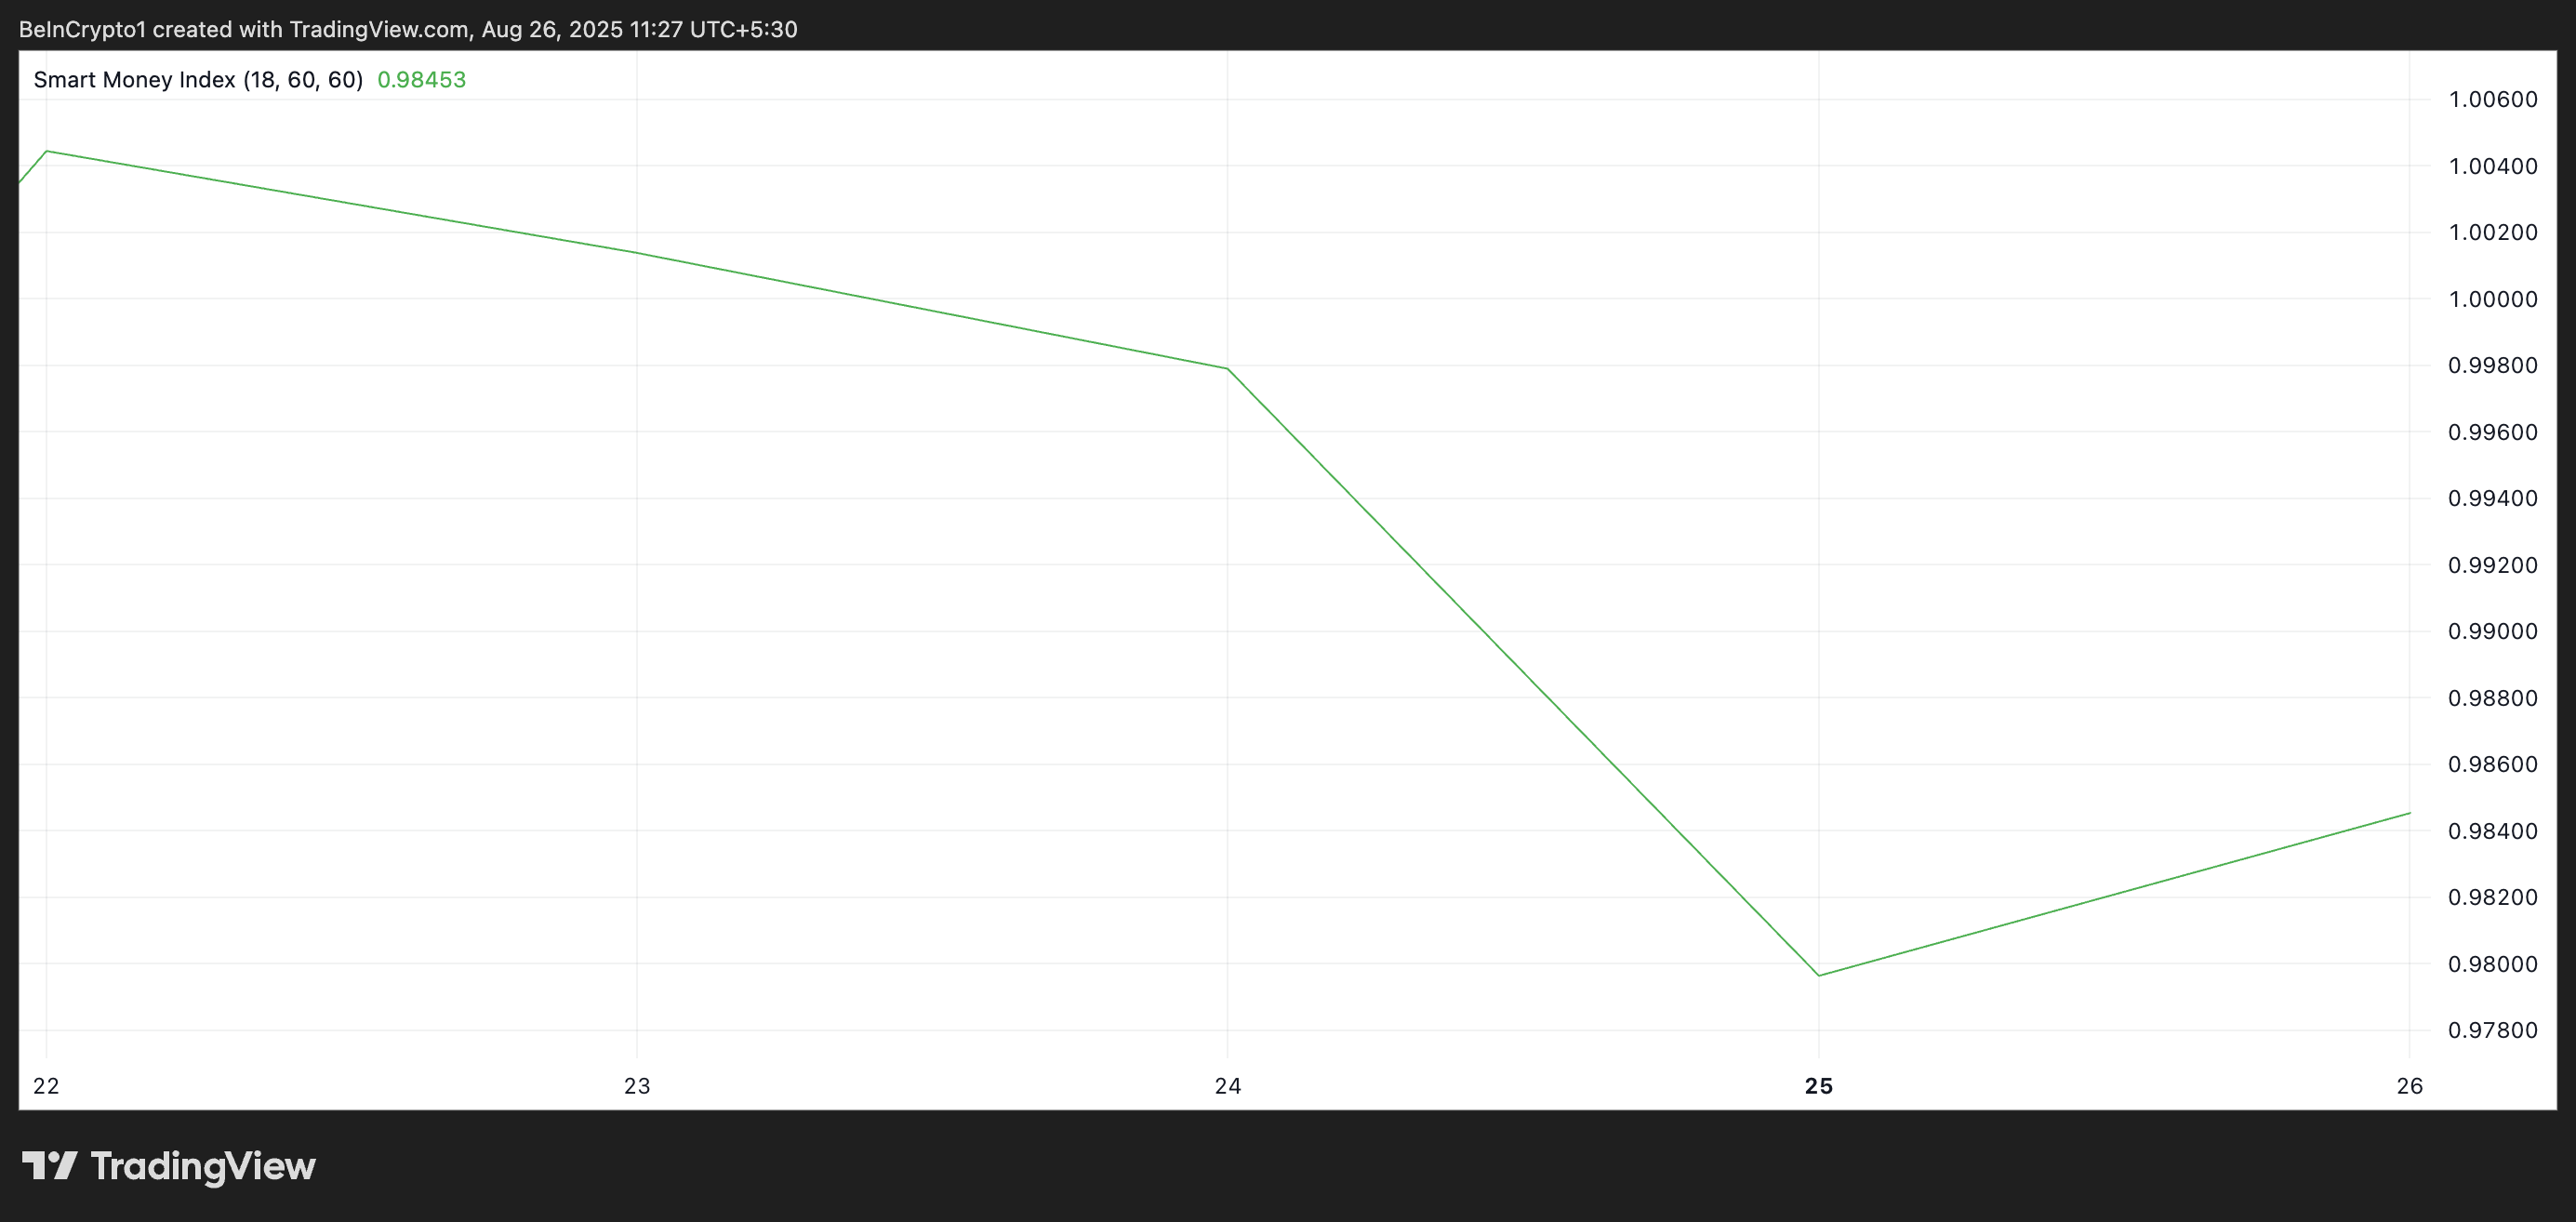
The SMI measures the activity of institutional investors by tracking price movements at specific times of the trading day. It reflects how “smart money” trades during the end-of-day sessions, after retail-driven volatility in the morning.
When the SMI spikes, it signals increased confidence from institutional investors, often indicating a bullish outlook.
On the other hand, when it drops, as with HBAR, these investors are less interested in holding their assets and are selling for profit. If this trend continues, it could exacerbate the downward push on HBAR’s price.
HBAR Bears Tighten Grip, But Bulls Still Eye $0.26 Breakout
If the weakness persists, HBAR’s price could fall below key support levels, opening the door to deeper losses. In this scenario, the altcoin could fall toward $0.22.
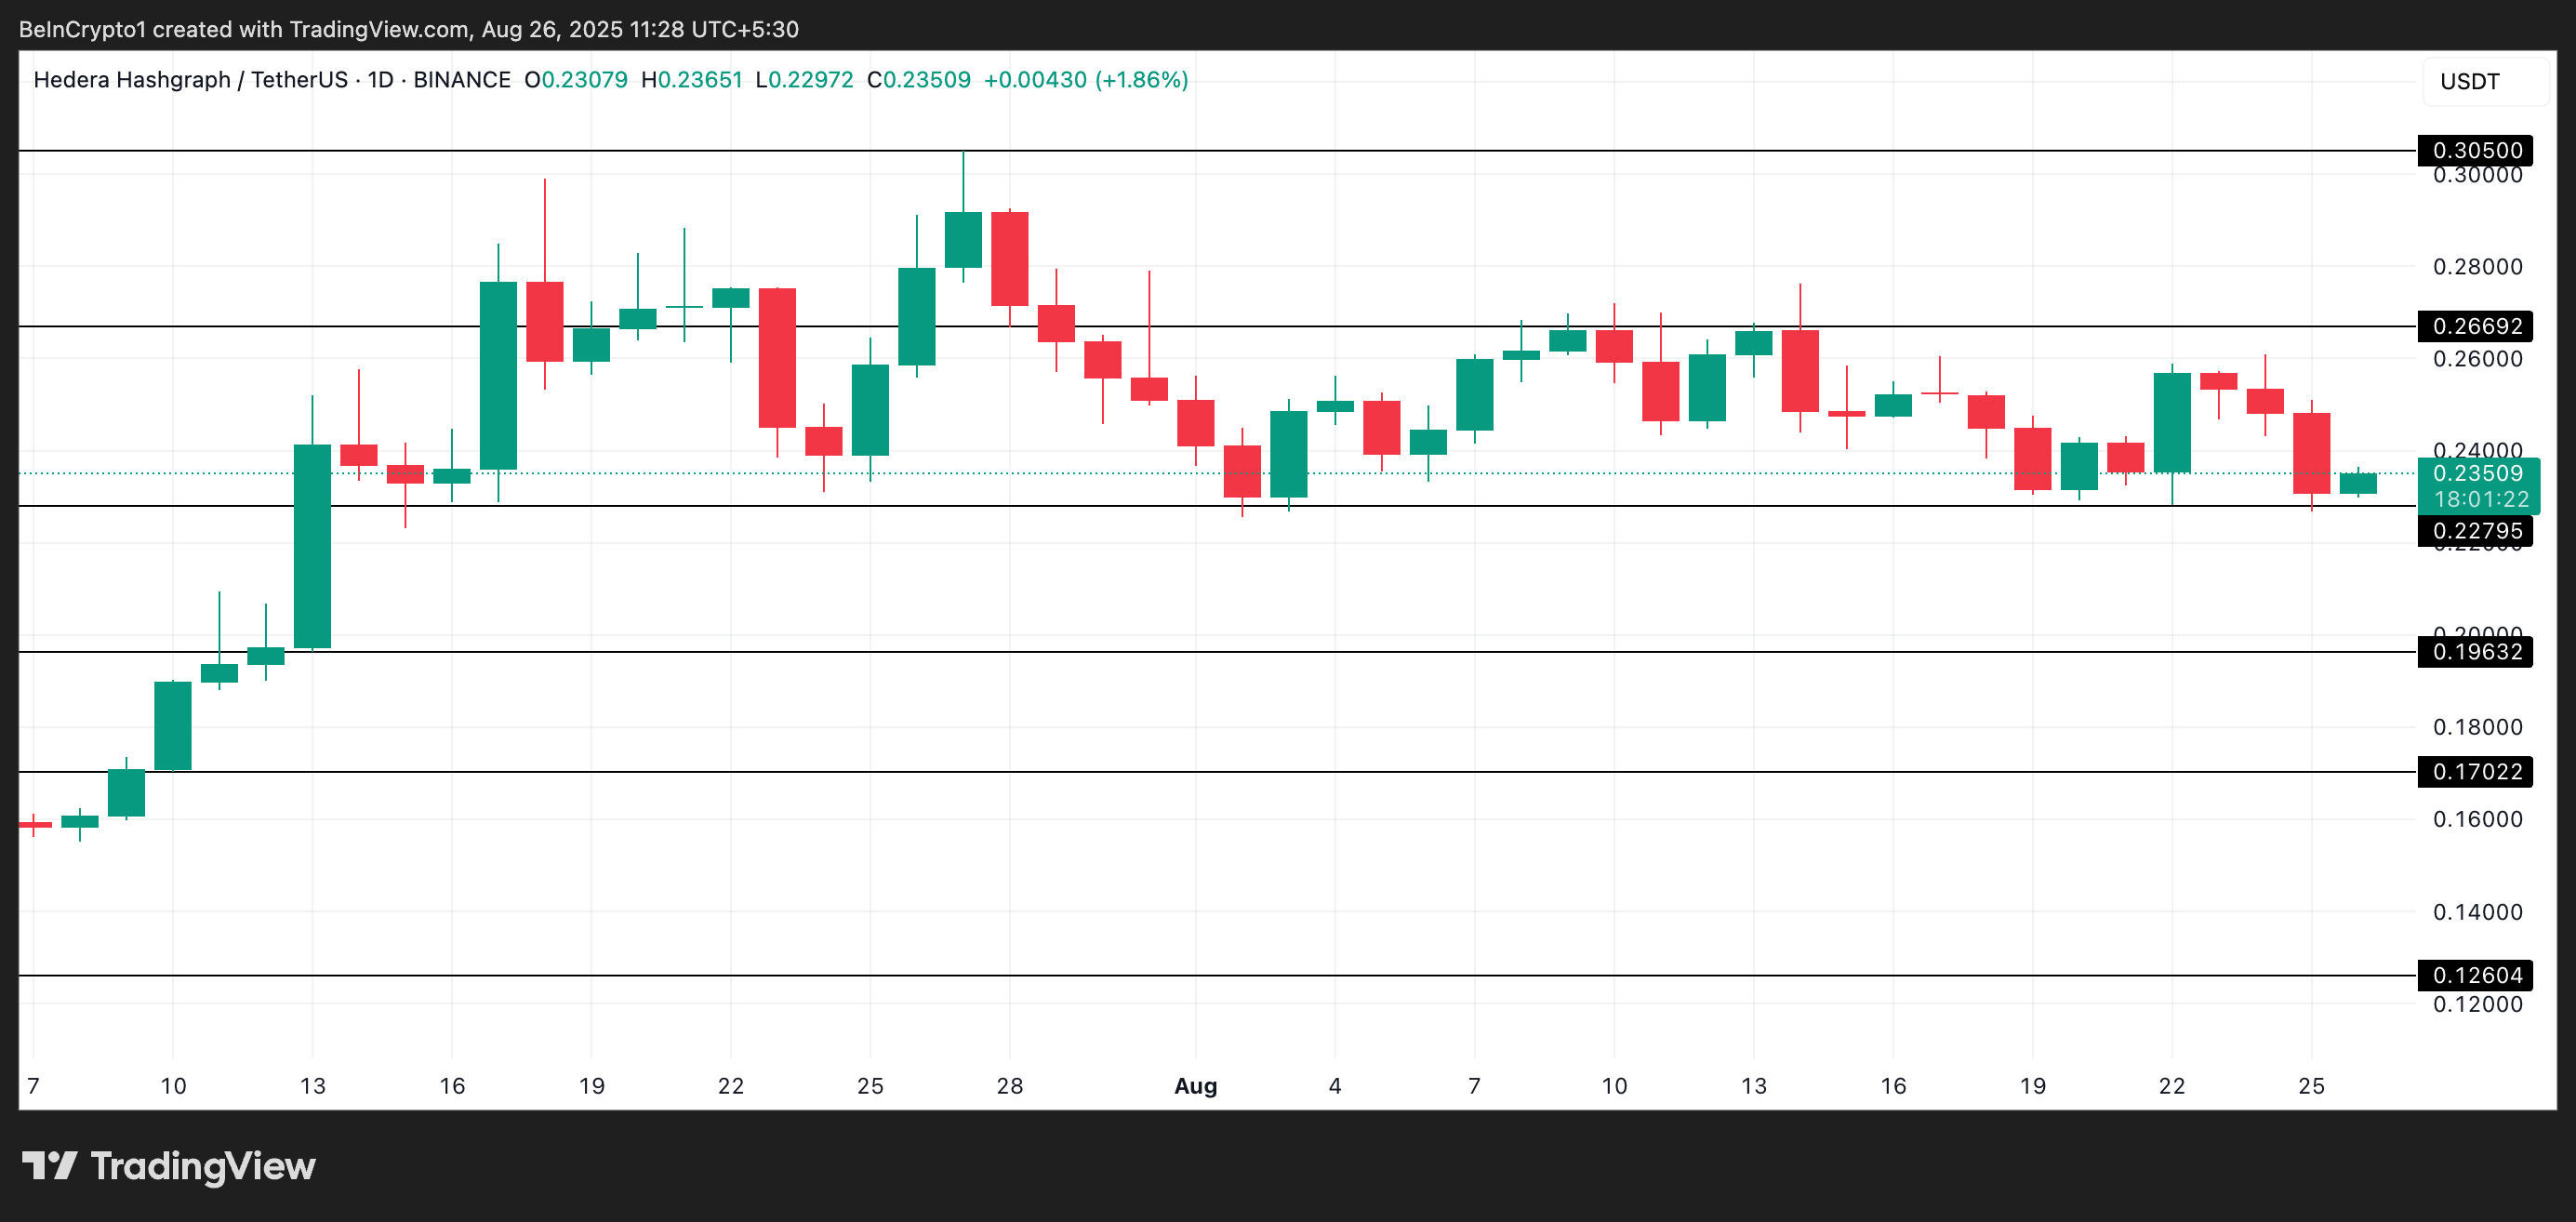
However, if new demand emerges, HBAR could regain strength, break the $0.26 resistance, and head to $0.30.
