Cardano Price Holds Bullish Pattern—But a 90% Drop in Key Metric May Spell Trouble

Cardano's price action keeps defying gravity—but the fundamentals just took a nosedive.
While the charts paint a bullish picture, a critical on-chain metric just cratered by 90%. That's not a typo. Ninety percent.
The Pattern Versus The Reality
Traders love patterns. Fundamentals? Not so much. ADA's technical setup screams breakout, but the network's vital signs tell a different story. Active addresses? Plummeting. Transaction volume? Evaporating. The kind of data that makes crypto analysts reach for the antacids.
When The Music Stops
Every bull run needs fuel. User growth, developer activity, actual utility—something. A 90% drop in any key metric isn't a blip; it's a five-alarm fire. It's the crypto equivalent of a restaurant with a beautiful facade and no customers inside.
Cardano might be painting a pretty technical picture, but in the ruthless casino of crypto, fundamentals have a nasty habit of eventually cashing the check the hype wrote.
Cardano’s 90% Drop in Outflow Hints at Buyer Weakness
Over the past few days, net outflows from ADA spot exchanges have slowed drastically. At its local peak, cardano recorded $40.07 million in daily outflows: a clear sign of strong buying conviction, as traders were pulling coins off exchanges.
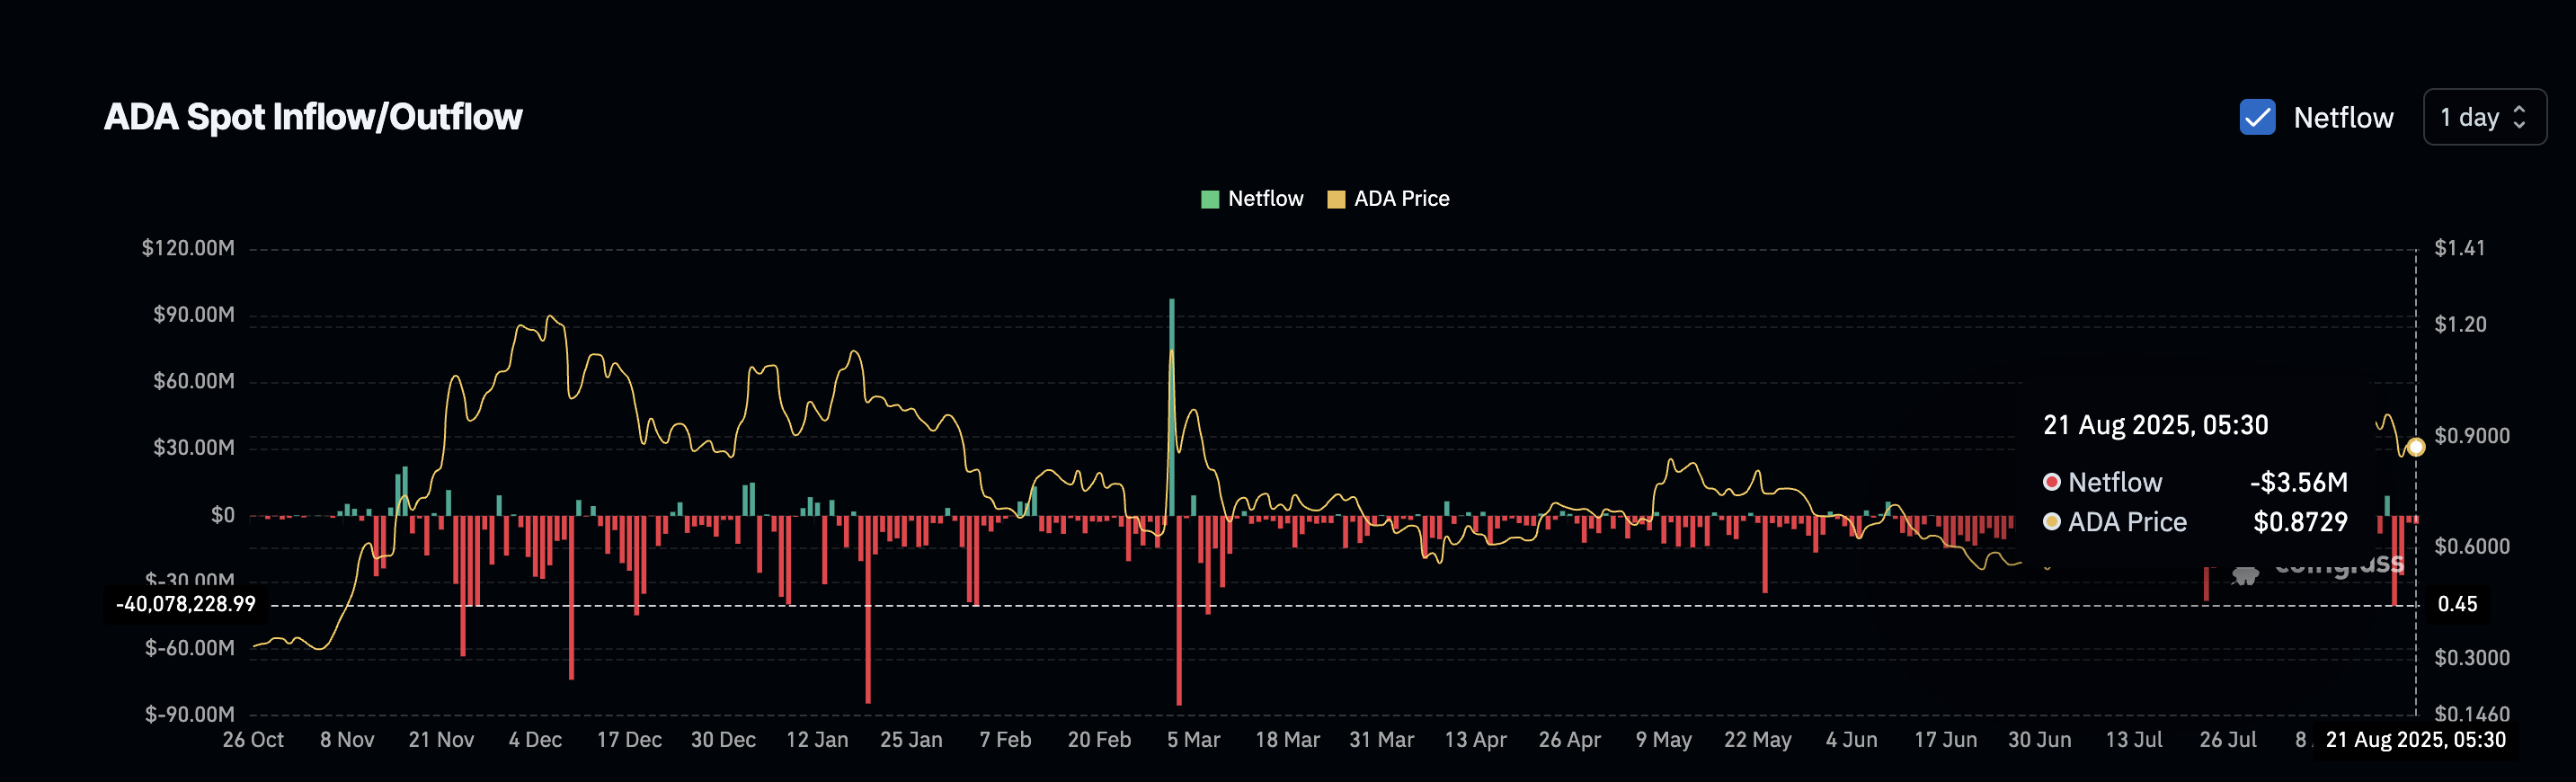
That conviction has faded. By August 21, ADA’s net outflow dropped to just $3.56 million. That’s a 91% decline from peak demand. While this still represents net outflow, the plunge in size suggests buyers are stepping aside. There’s still no aggressive inflow, but momentum has stalled.
: Want more token insights like this? Sign up for Editor Harsh Notariya’s Daily crypto Newsletter here.
Too Many Longs? Leverage Stack Could Add Fuel to the Fire
Liquidation map data shows ADA’s long positions are stacked dangerously tight. On Bitget, over $174.80 million in long leverage is built up, compared to just $73.56 million in shorts.
The biggest leveraged cluster sits near $0.83 to $0.85, meaning if the Cardano price drops to that range, liquidations could snowball. Even though too many Long positions signify positive bias but an imbalance as this can lead to a long squeeze.
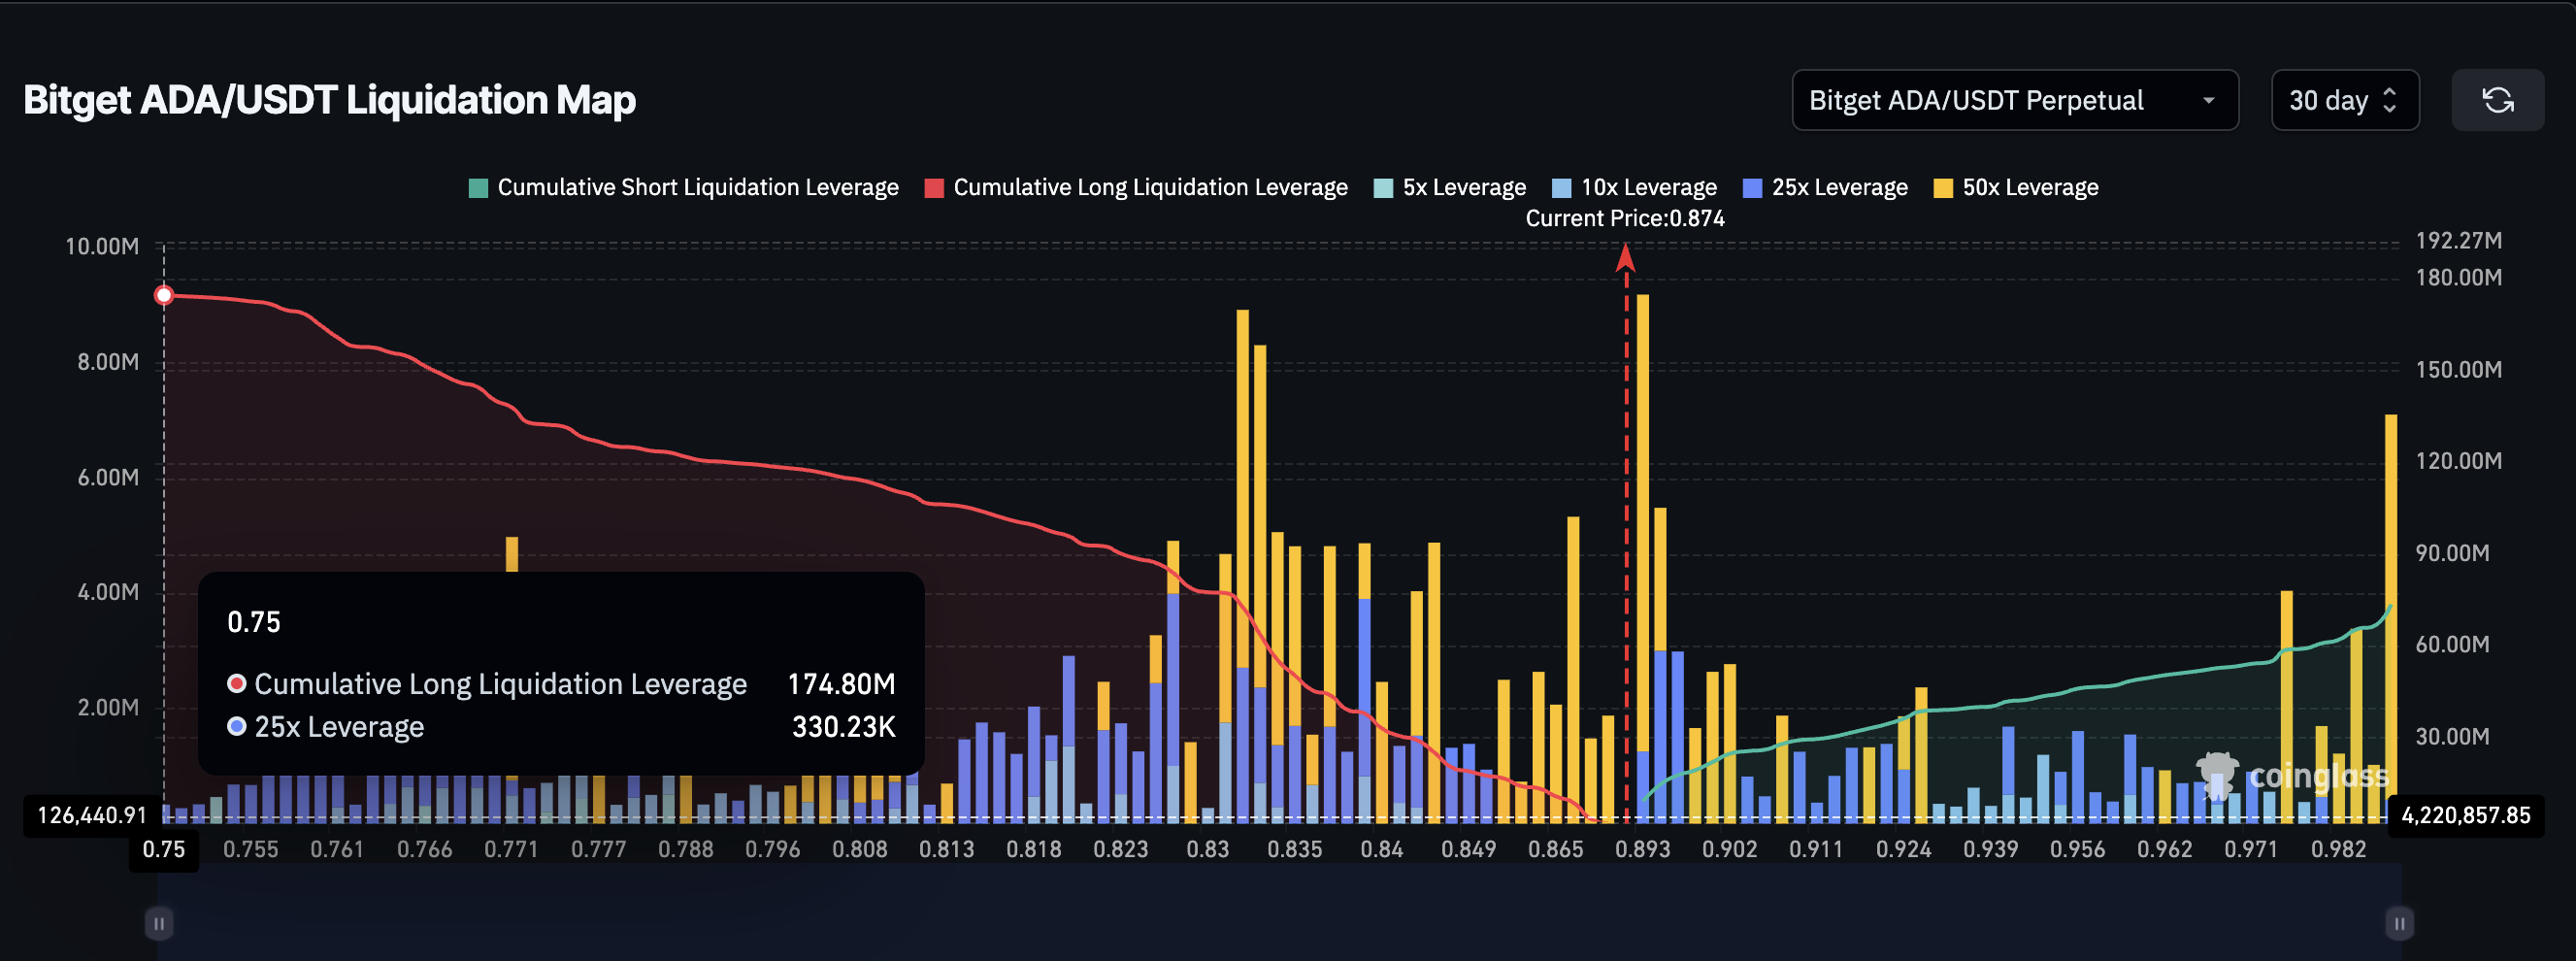
With most of the market betting long, a dip below the key support level could cause fast unwinding and volatility.
It’s a classic overload setup. Bullish traders may unknowingly be fueling a sudden MOVE down, especially since the price is sitting right on top of key long clusters, and sellers are starting to gain strength.
Cardano Price Pattern Remains Intact, But Pressure Points Are Building
On the daily chart, the cardano price continues to trade within an ascending triangle. The immediate breakout level sits at $0.91. If that clears, ADA could run toward $1.01–$1.10, backed by the most important 0.5 and 0.618 Fibonacci extension levels.
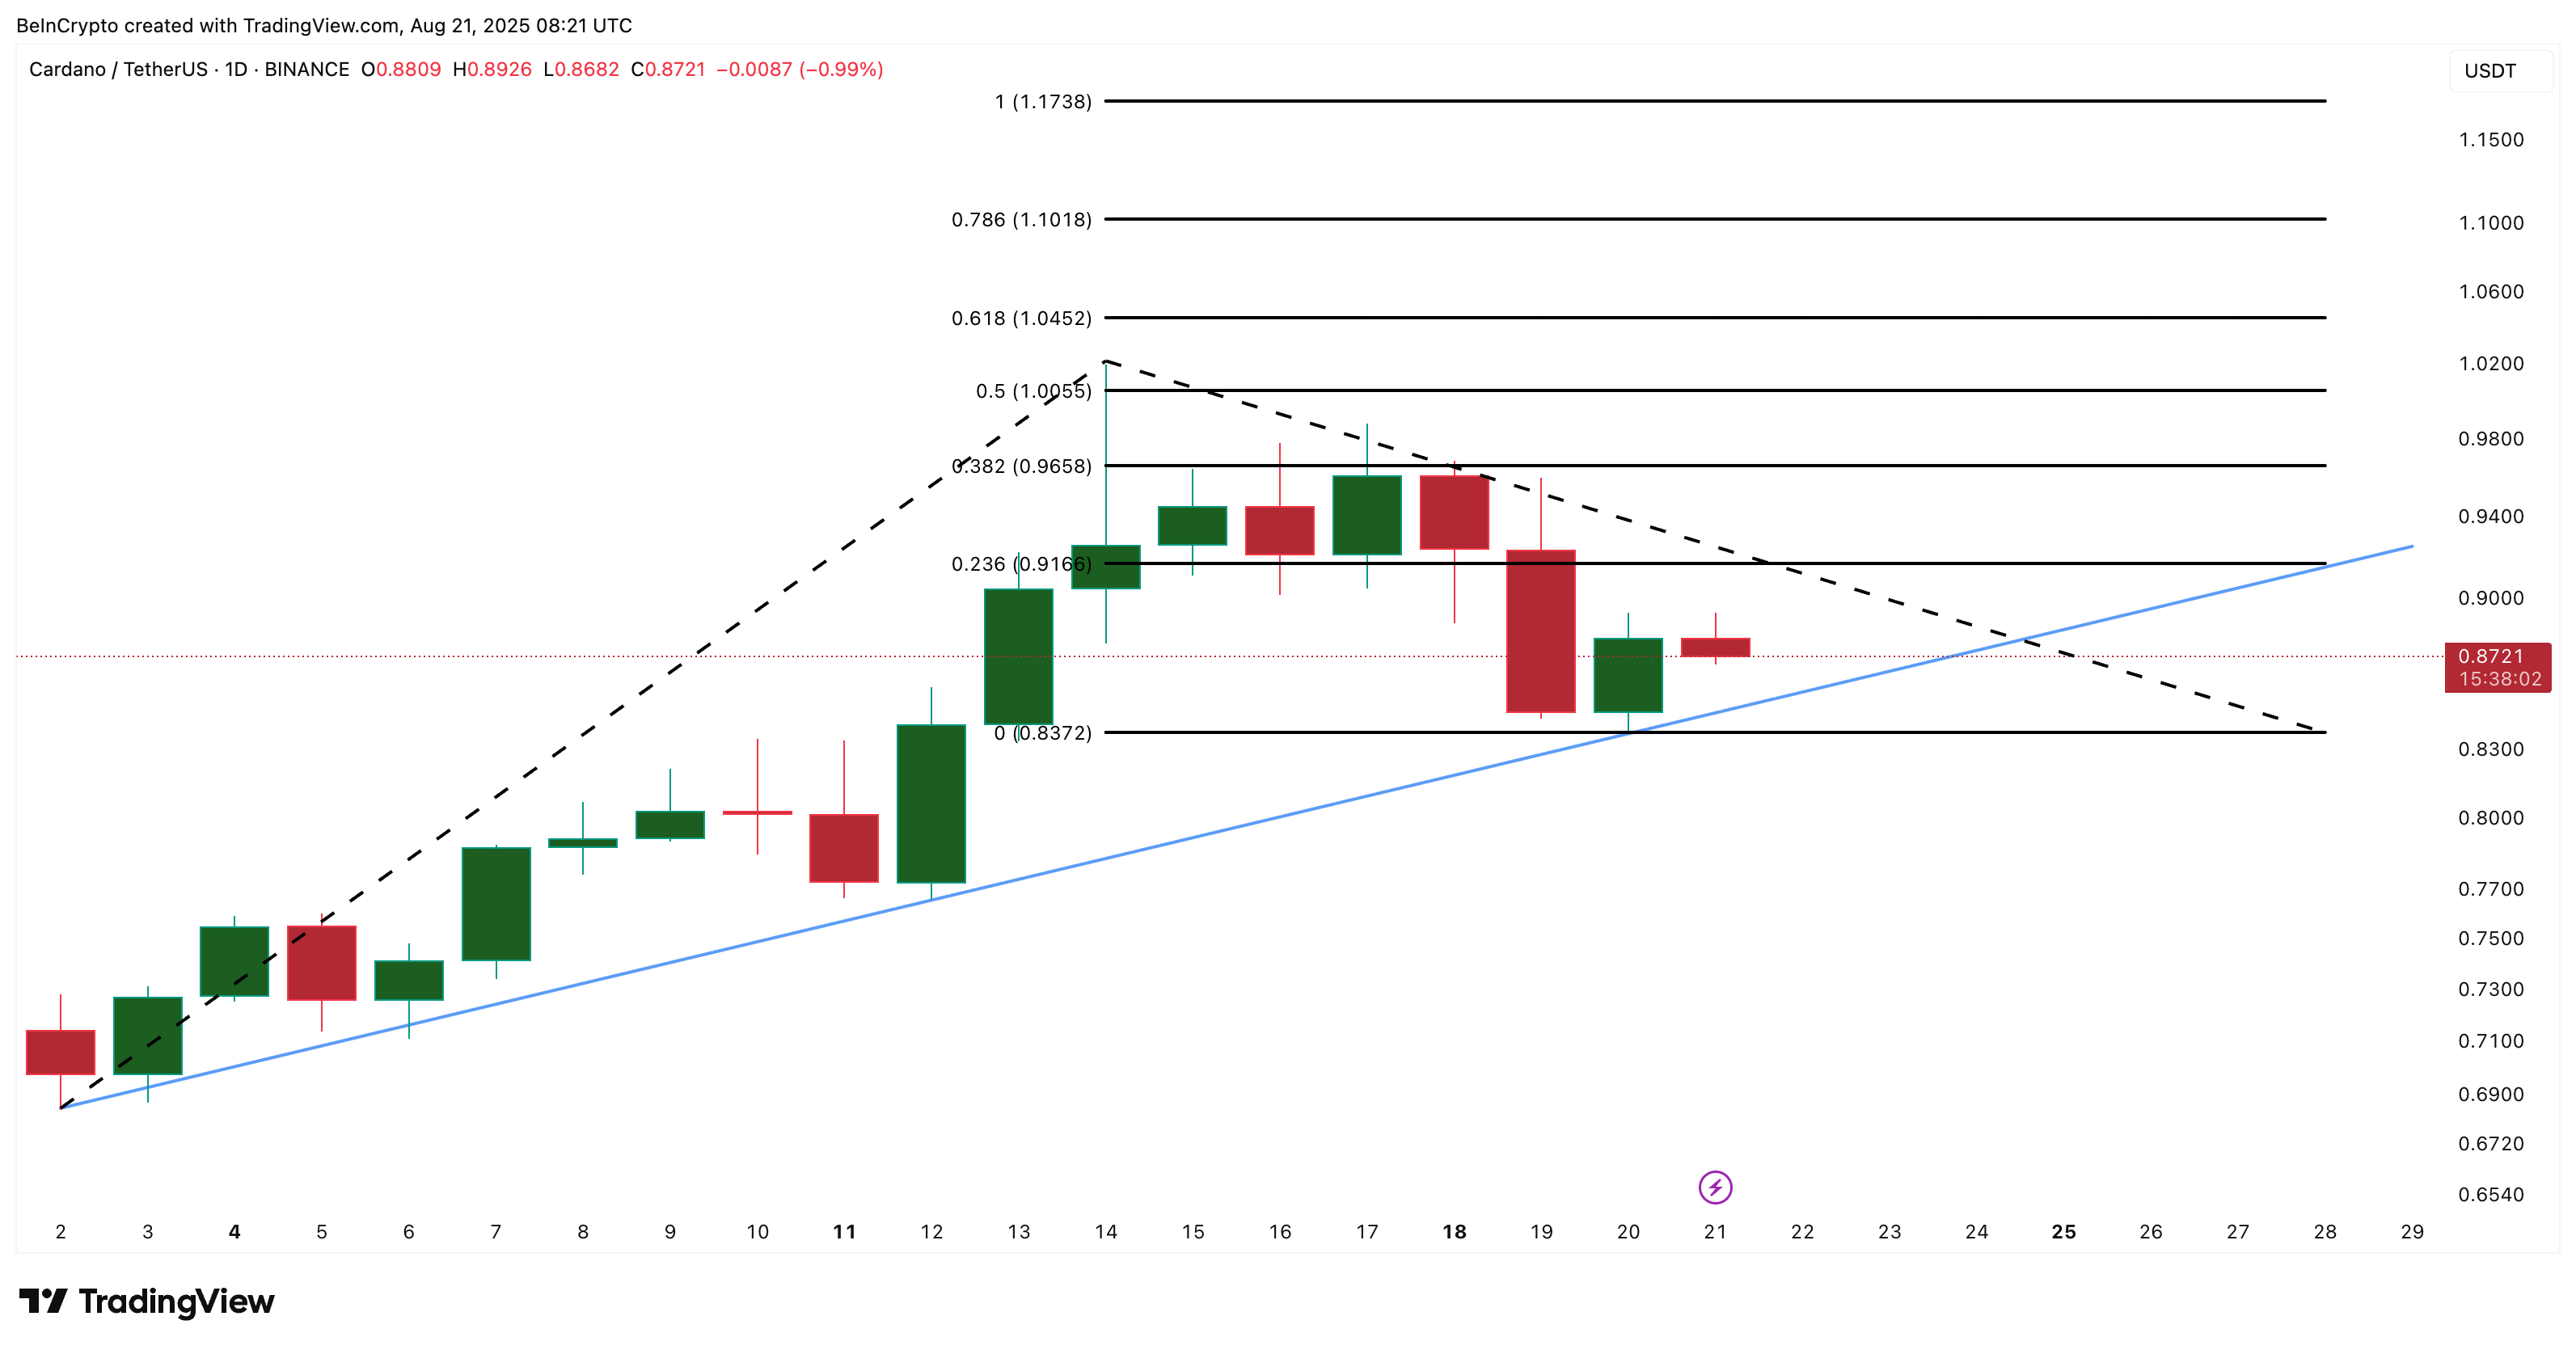
But the support line at $0.83 is now critical. If the ADA price breaks below this, the triangle pattern breaks down, and all bullish setups become invalidated.
With reduced outflow support and leverage imbalance, this level is no longer well-defended. The Cardano price may look bullish structurally, but it’s leaning on weakening legs.
