Toncoin (TON) Surges 14% Amid Market Slump—$4 Target in Sight?

While the broader crypto market drags its feet, Toncoin (TON) is sprinting ahead—posting a 14% gain when others can barely muster a green candle. Is this the breakout that propels TON to $4?
Defying the downtrend
Most altcoins are stuck in sideways purgatory, but TON’s double-digit surge stands out like a neon sign in a blackout. No fancy narratives, no ETF hype—just raw upward momentum while Bitcoin waffles around $30K.
The $4 question
If TON clears its immediate resistance, that psychological $4 level becomes the next battleground. Traders are watching volume closely—this isn’t some low-float meme coin pumping on vapor.
Of course, in crypto, today’s breakout often becomes tomorrow’s ‘buy the rumor, sell the news’ trap. But for now, TON holders are enjoying that rarest of sights: a chart that doesn’t look like a dying EKG. (And yes, Wall Street analysts are still trying to figure out whether ‘blockchain’ is a stock ticker or a new yoga position.)
TON’s Price Primed for More Action
According to Coinglass, TON’s liquidation heatmap shows a sizable concentration of liquidity around the $3.77 price zone.
: Want more token insights like this? Sign up for Editor Harsh Notariya’s Daily crypto Newsletter here.
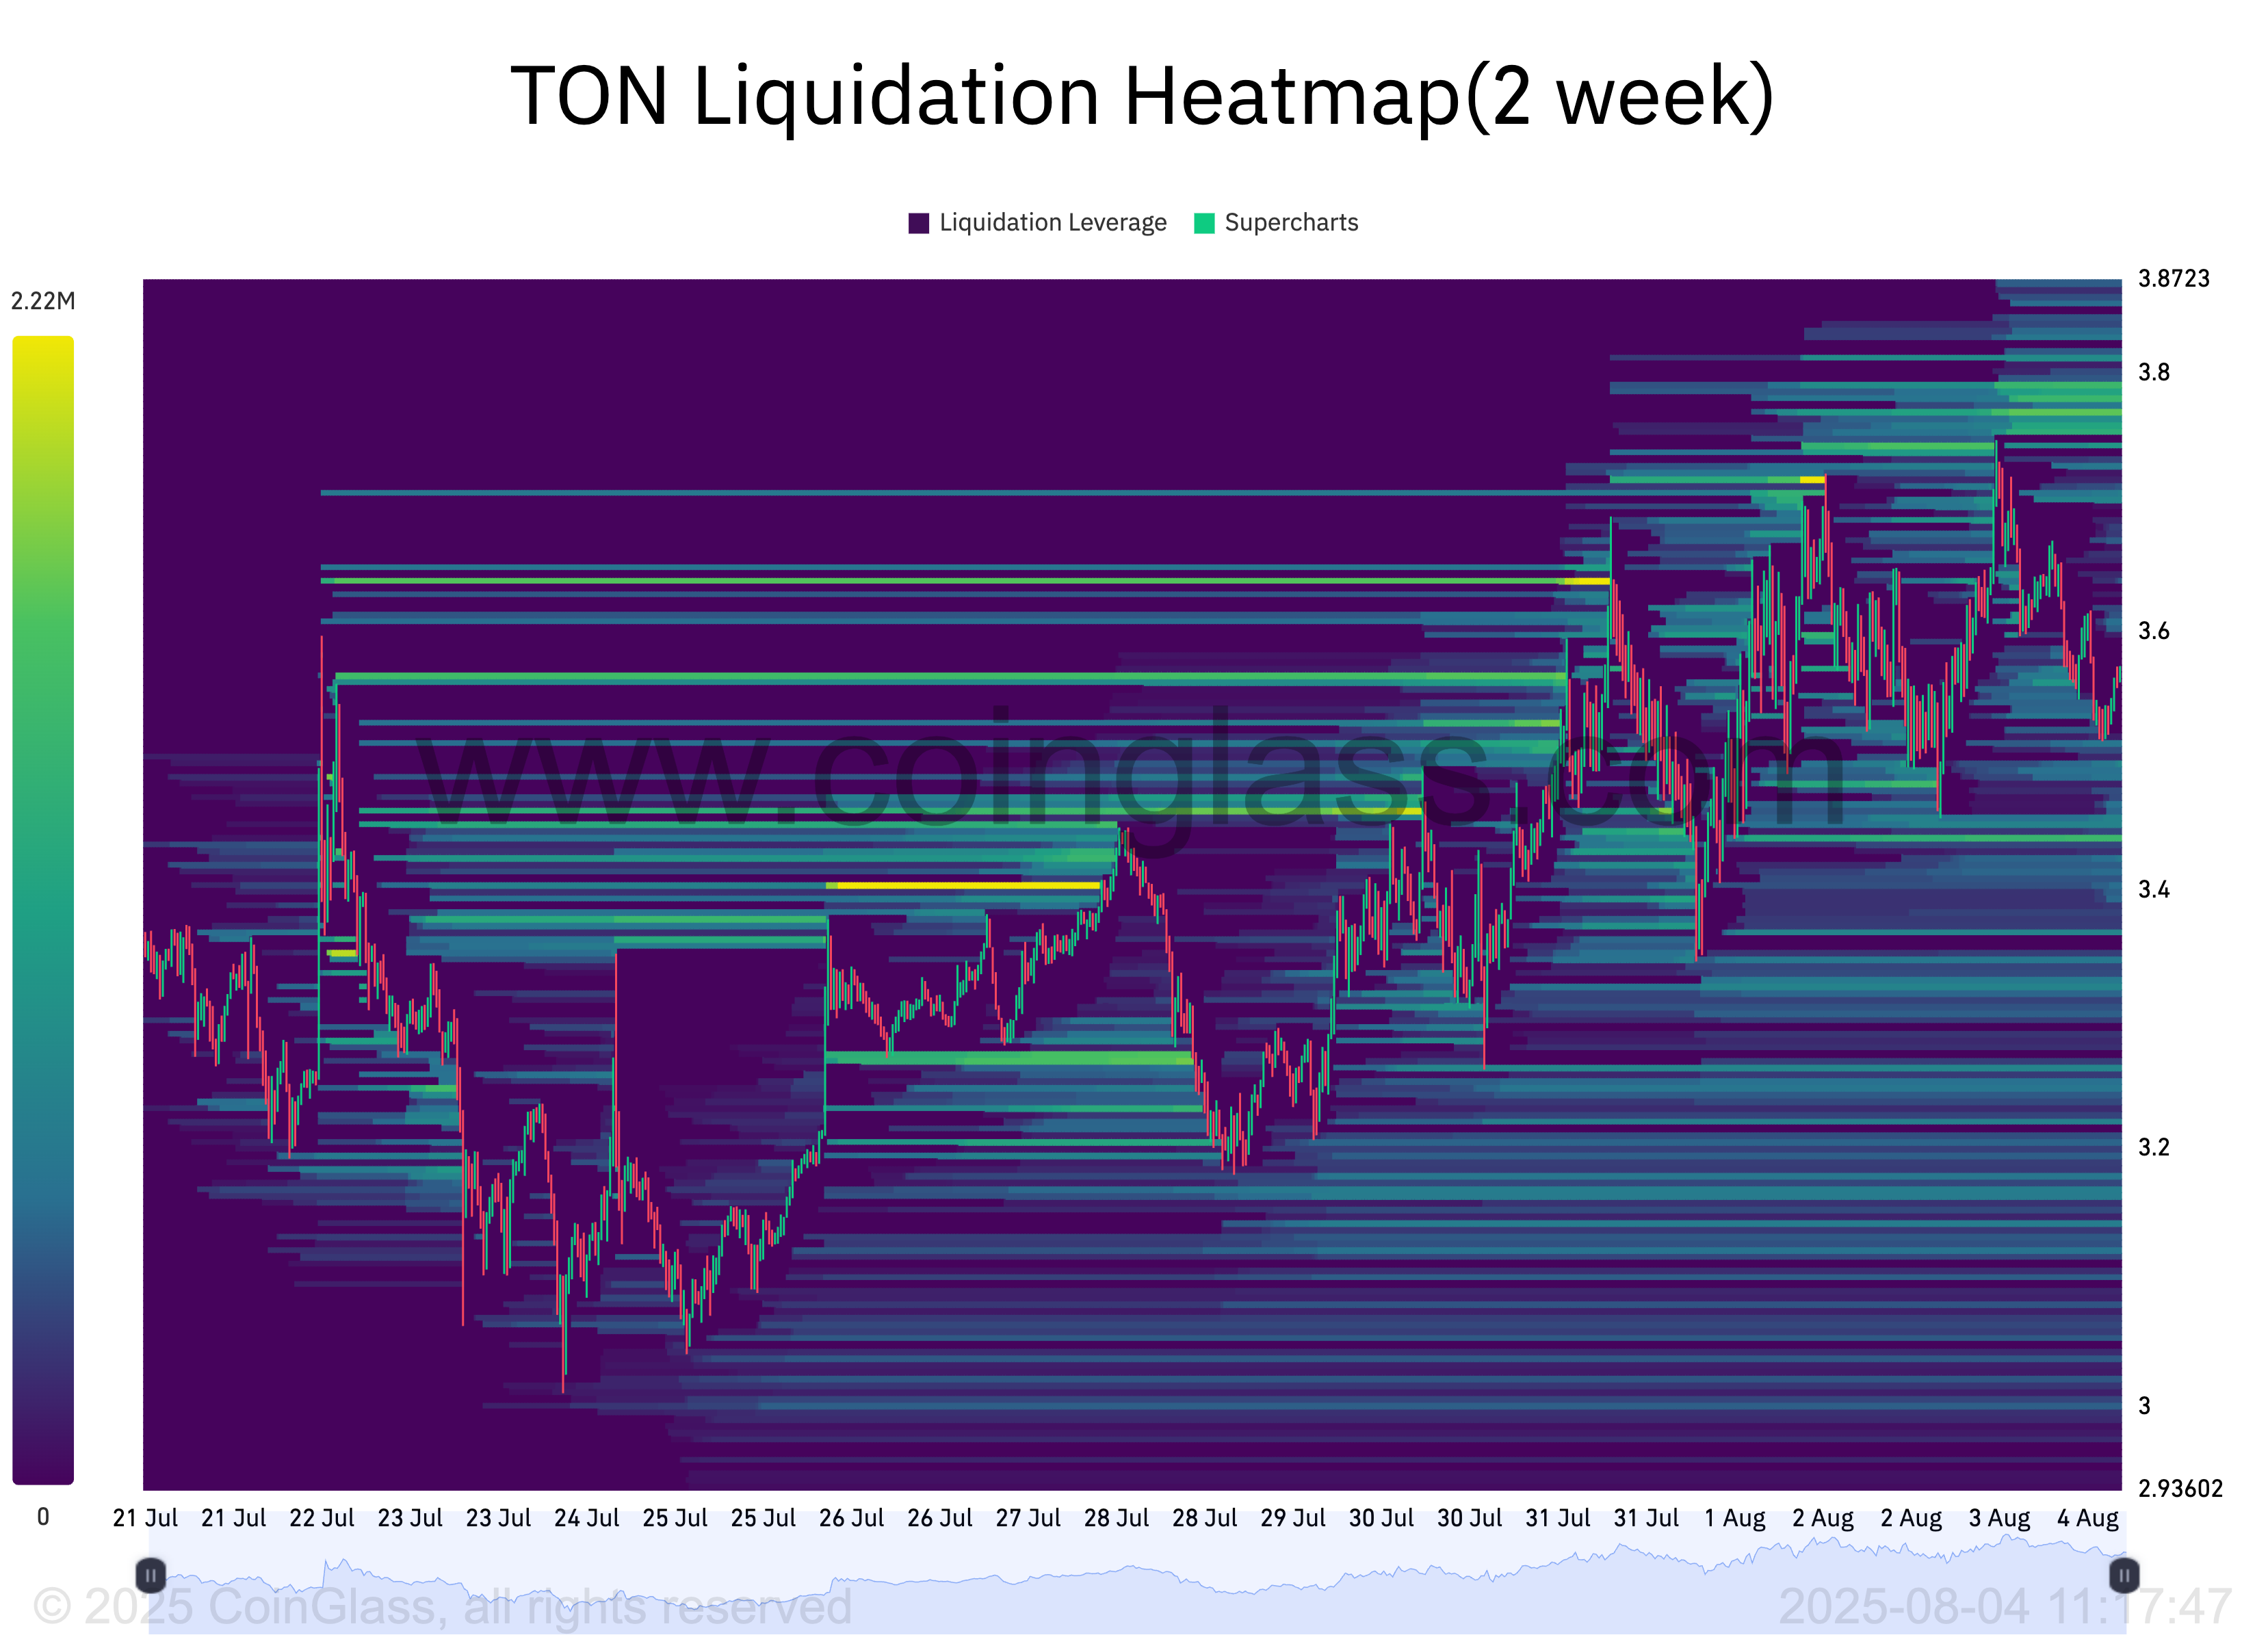
These heatmaps are visual tools that help traders identify price levels where large clusters of Leveraged positions are likely to be liquidated. They highlight areas of high liquidity, with brighter zones representing larger liquidation potential.
For TON, the liquidity cluster around $3.77 shows strong interest from traders looking to buy or close out shorts. That setup could easily spark a fresh price rally soon.
Furthermore, from a technical standpoint, TON’s Relative Strength Index (RSI) remains in a healthy range, indicating there is still room for more growth. At press time, the momentum indicator stands at 67.21.

The RSI indicator measures an asset’s overbought and oversold market conditions. It ranges between 0 and 100. Values above 70 suggest that the asset is overbought and due for a price decline, while values under 30 indicate that the asset is oversold and may witness a rebound.
TON’s RSI readings indicate market participants are still leaning bullish, with room for more upside before buyers become exhausted.
TON Traders Bet on Upside
Amid ongoing market volatility and repeated attempts to push prices down, TON’s funding rate has remained firmly positive, confirming the bullish bias among its futures traders. At press time, it sits at 0.0061%.

The funding rate is a mechanism used in perpetual futures contracts to keep prices aligned with the spot market. When it’s positive, it means long traders (those betting on price increases) are paying short traders. This signals that the majority of market participants are leaning bullish.
A consistently positive funding rate suggests strong confidence in TON’s upward potential, even in the face of broader market uncertainty.
Buy-Side Pressure Builds—Will It Be Enough to Breach $4?
With on-chain and technical indicators confirming the buy-side pressure, TON appears poised to extend its rally in the short term. The token could breach resistance at $3.68 in this scenario and rally toward $4.02.
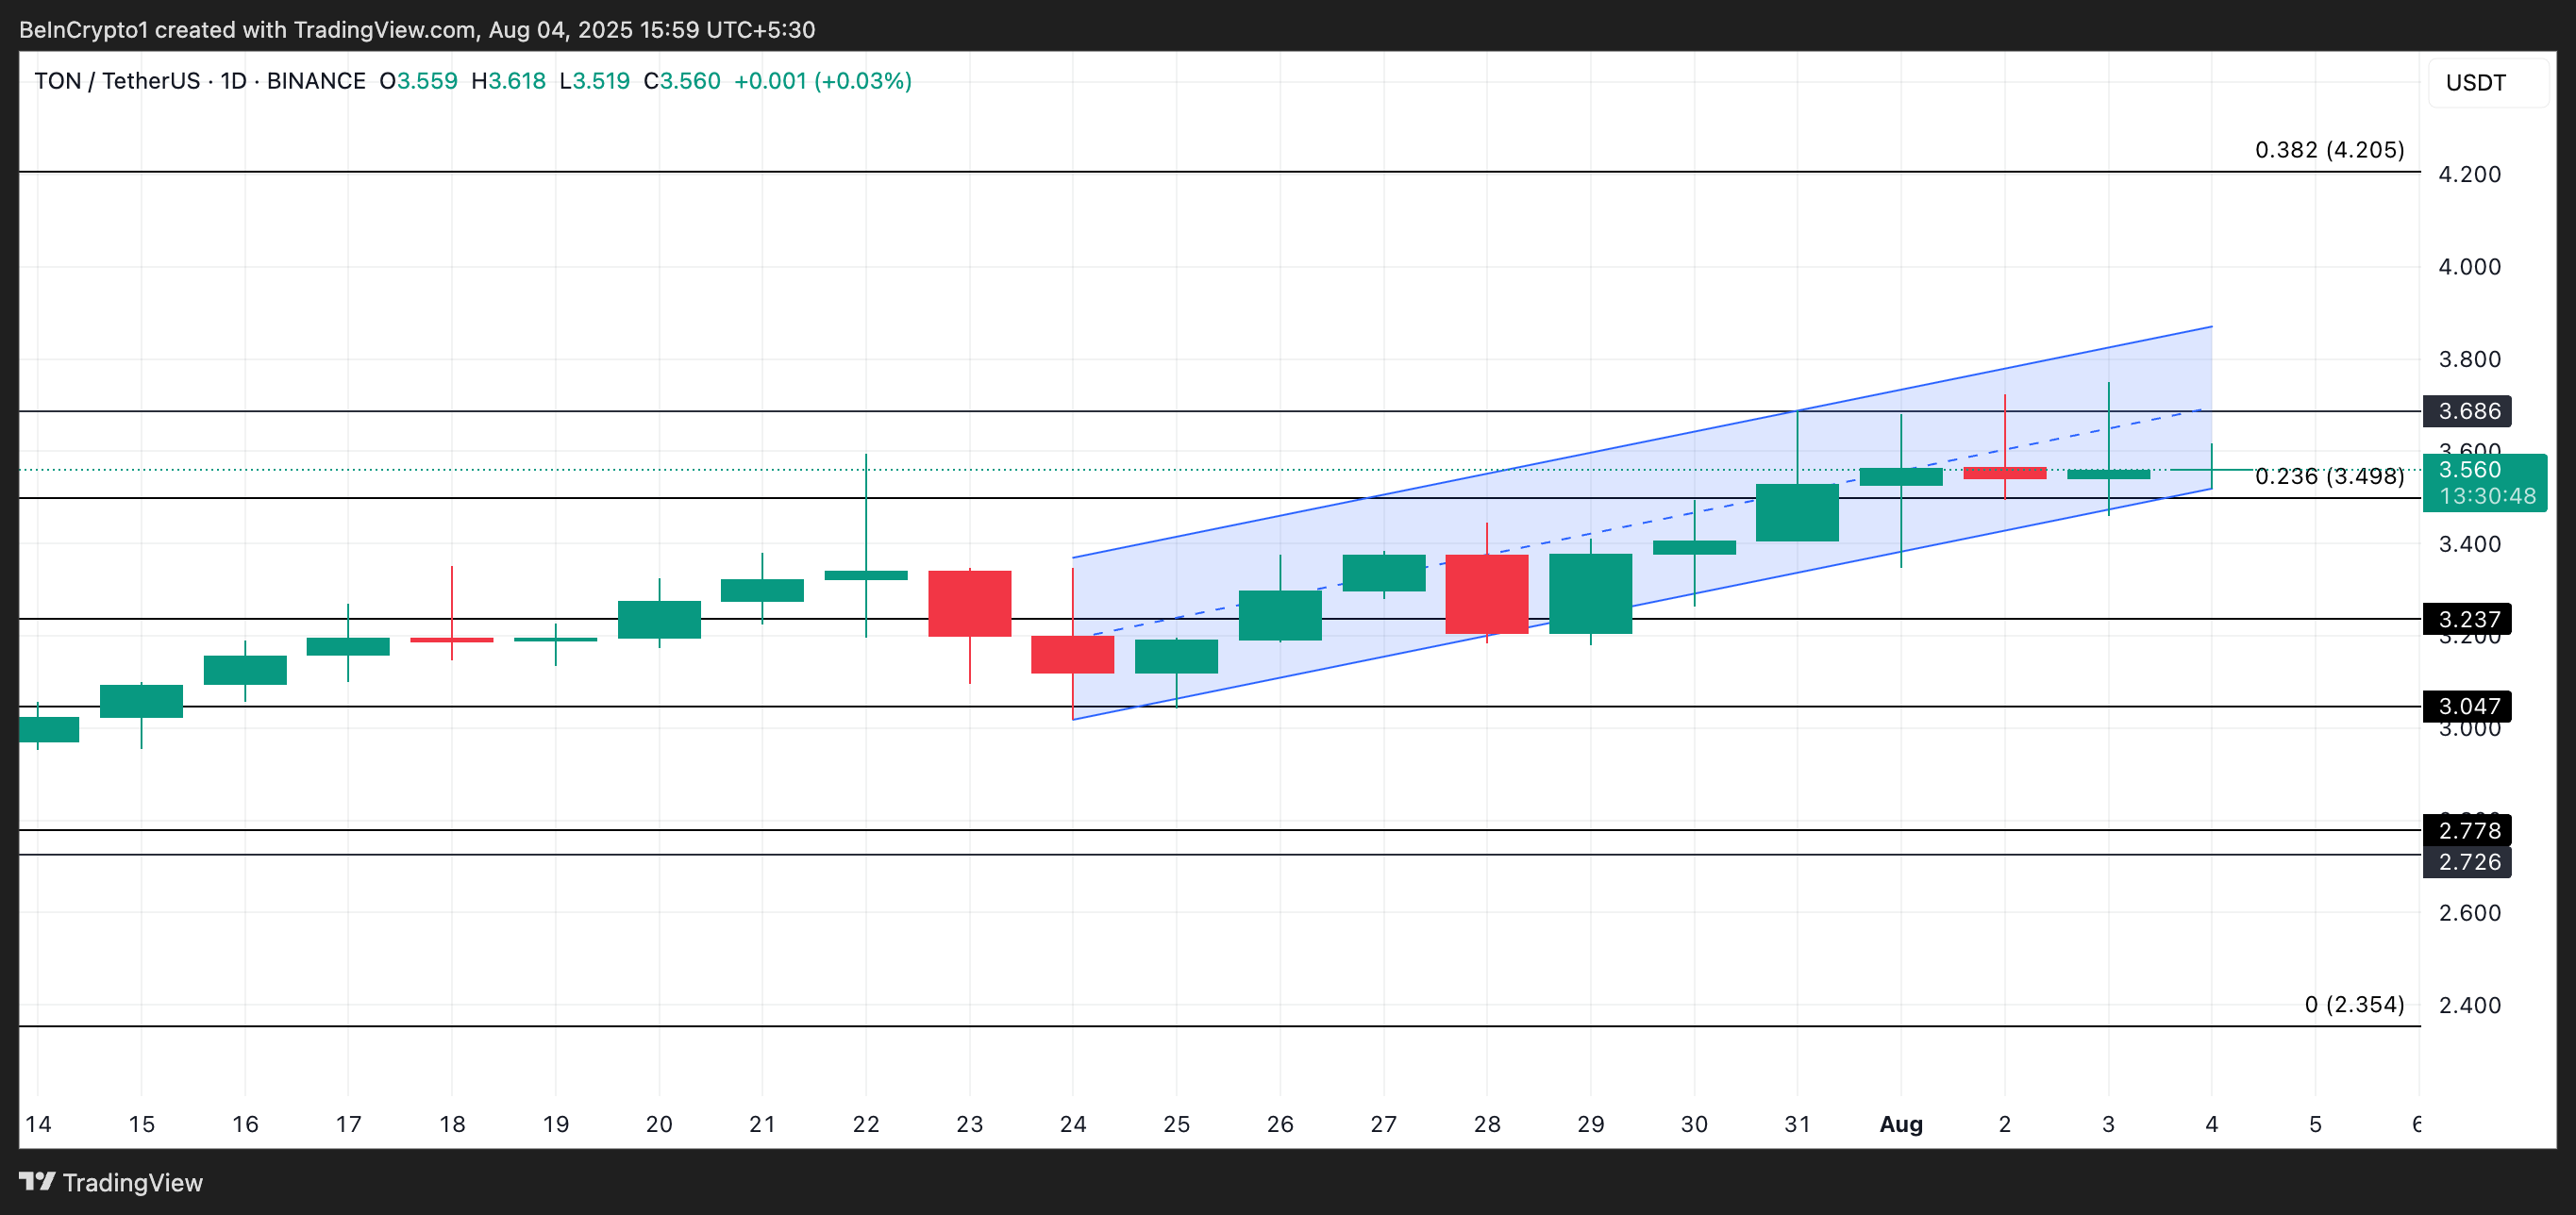
On the other hand, if demand falls and the bears regain dominance, they could push the altcoin’s price below $3.49.
