PENGU’s Liquidation Heatmap Signals Imminent Short-Squeeze Rally—Here’s Why

Traders are eyeing PENGU’s liquidation heatmap like hawks—and the setup screams volatility. When liquidity clusters align just right, even degens know what comes next: a textbook short-term pump.
### The Liquidation Trigger Playbook
Market makers didn’t stack those sell walls for charity. PENGU’s heatmap reveals dense liquidation zones where overleveraged shorts could get steamrolled. One whale-sized buy order? Cue the domino effect.
### Why This Time Isn’t Different (But Feels Like It Is)
Sure, crypto loves recycling narratives—but liquidity dynamics don’t lie. The last time PENGU’s heatmap flashed this pattern, it ripped 40% in 72 hours. History might not repeat, but it sure rhymes.
### The Cynic’s Footnote
Let’s be real: this ‘analysis’ is just fancy guesswork dressed in TradingView lipstick. But in a market where ‘number go up’ is the only thesis that matters, sometimes the chart voodoo works—until it doesn’t.
PENGU Gears Up for Another Leg Higher
Two key on-chain metrics suggest the rally might not be over. First, an assessment of PENGU’s liquidation heatmap reveals a significant liquidity cluster just above the current price, around the $0.045 level.
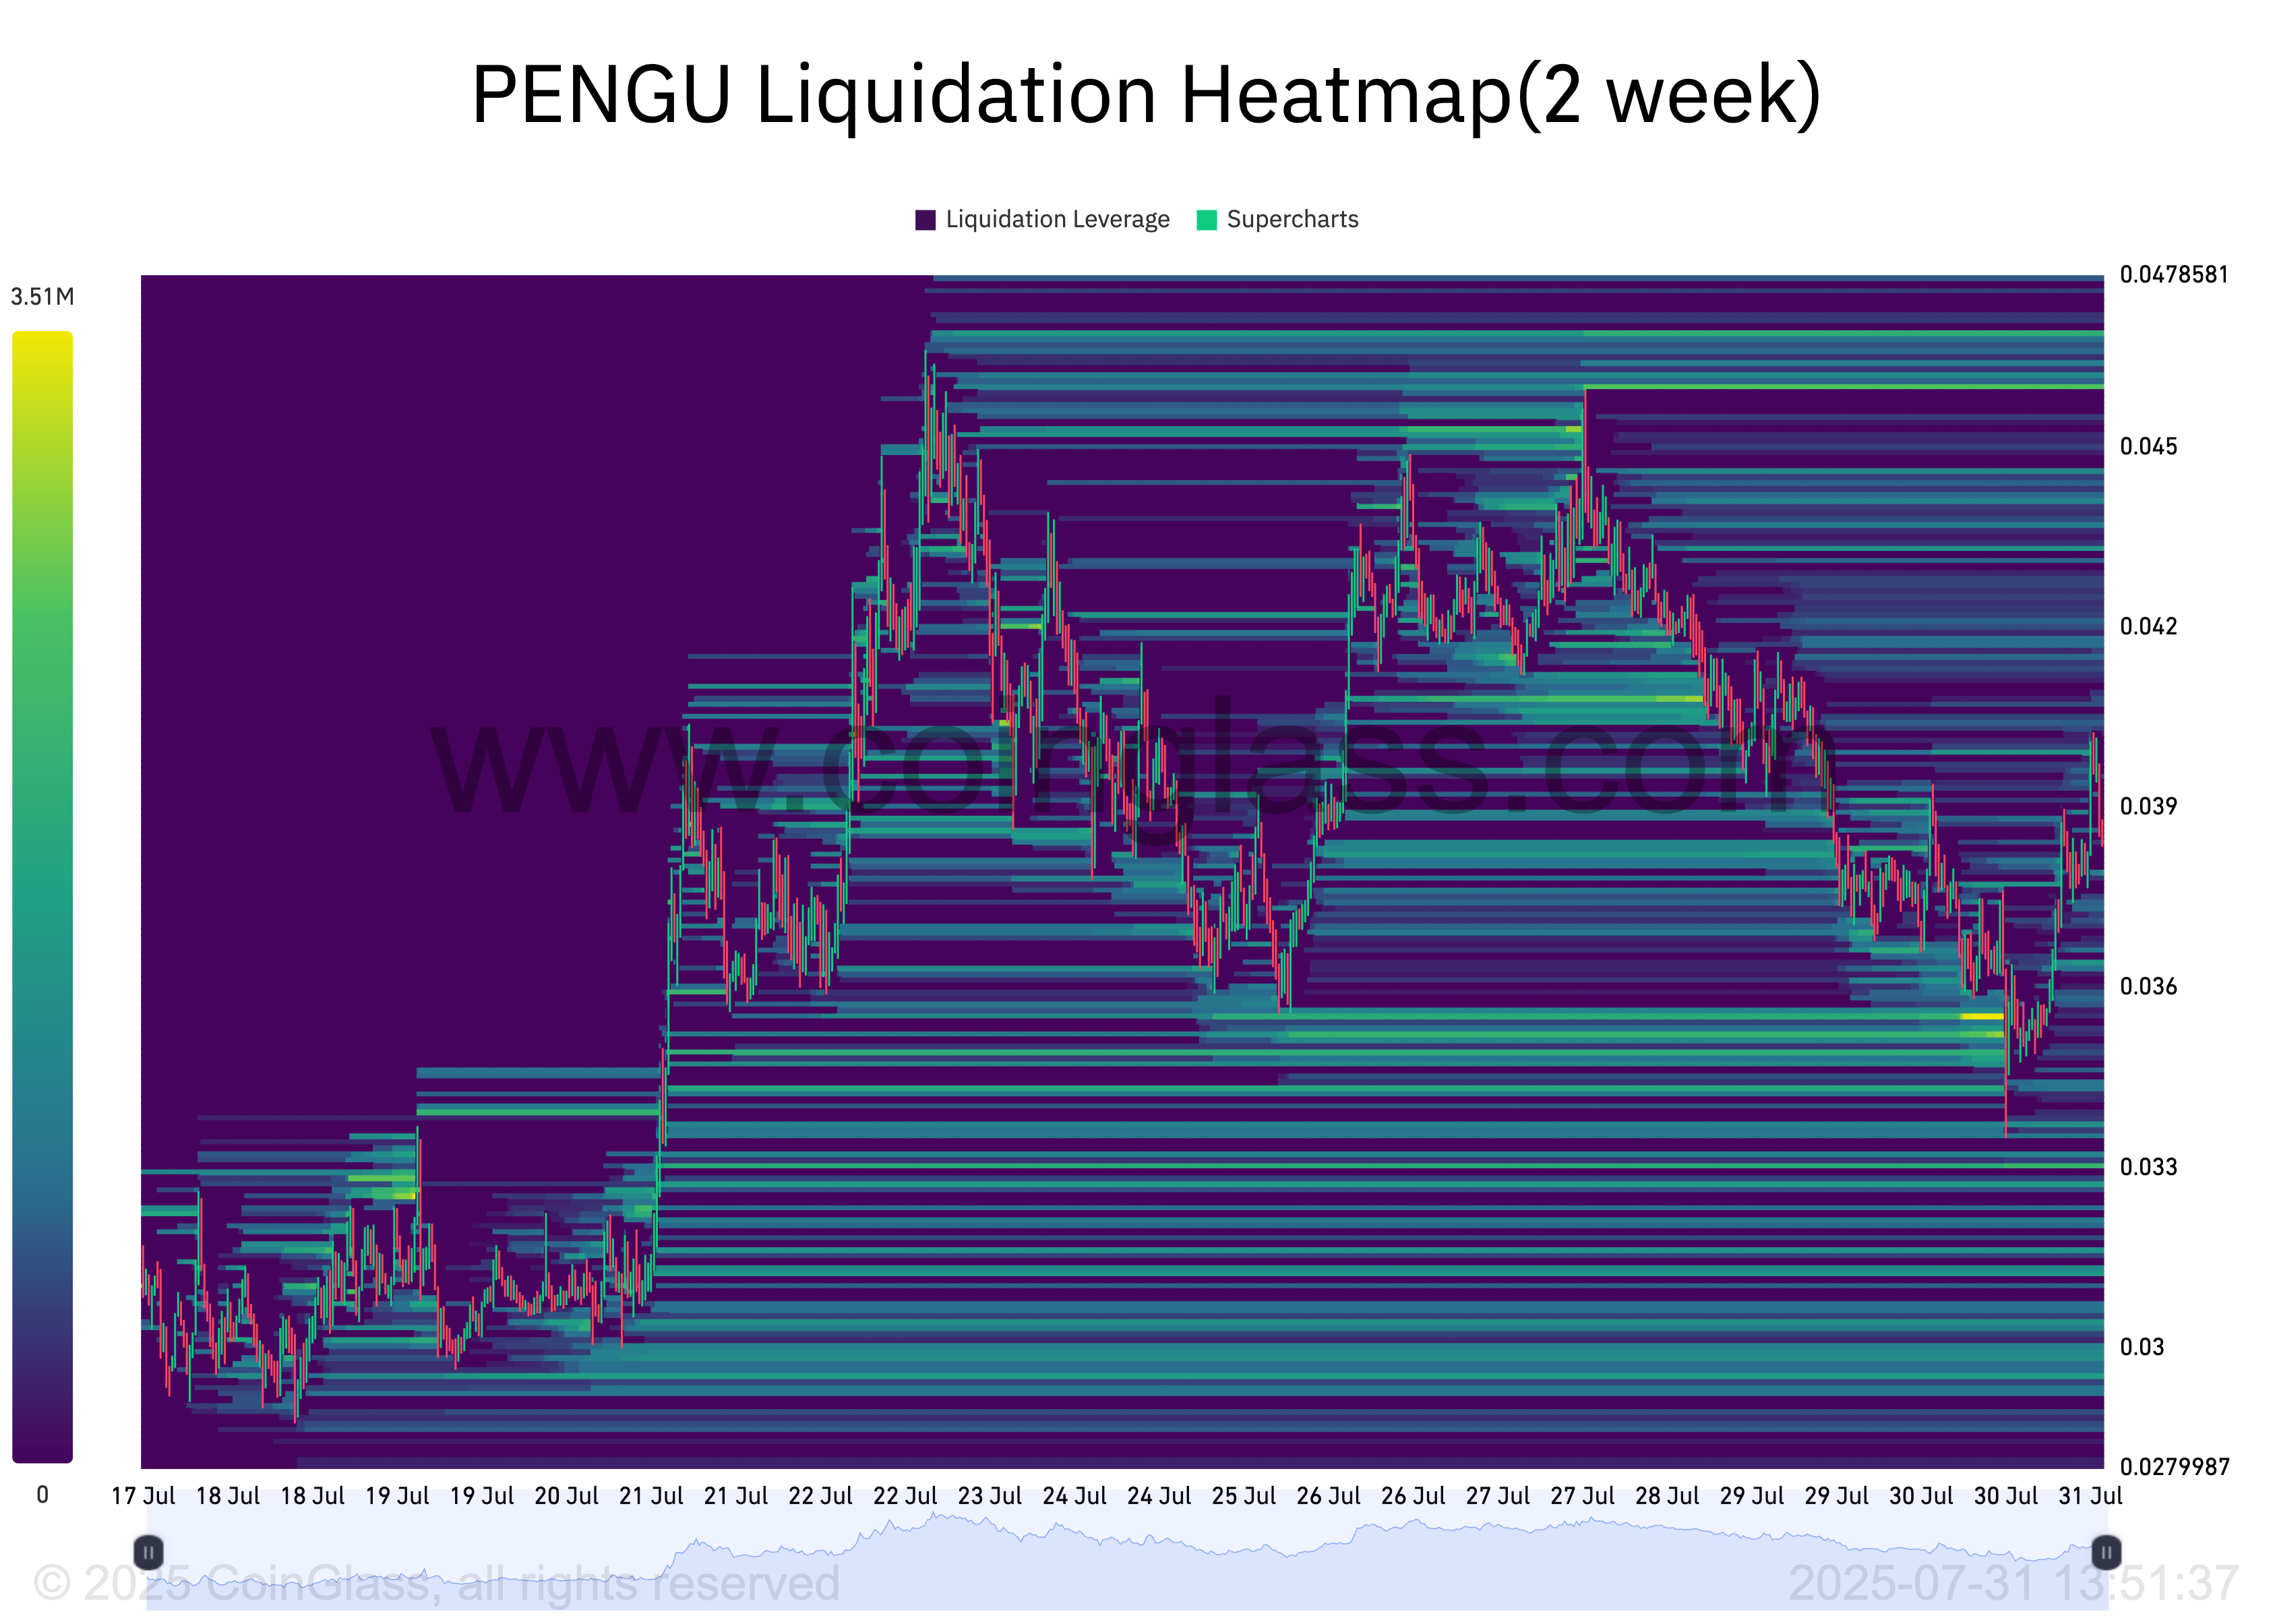
Liquidation heatmaps are used to identify price levels where clusters of Leveraged positions are likely to be liquidated. These maps highlight areas of high liquidity, often color-coded to show intensity, with brighter zones (yellow) representing larger liquidation potential.
When liquidity clusters FORM above an asset’s current market price, they often act as magnets, drawing the price upward. These zones are commonly targeted by traders aiming to trigger stop-losses or forced liquidations. This is because they know it can create a surge in buy-side pressure and fuel short-term bullish momentum.
For PENGU, the liquidity cluster around $0.045 could serve as a price magnet. It could potentially pull the meme coin’s value higher as traders push the market toward that zone.
Furthermore, PENGU’s long/short ratio has surged to a monthly high of 1.06, highlighting the bullish conviction among derivatives traders.
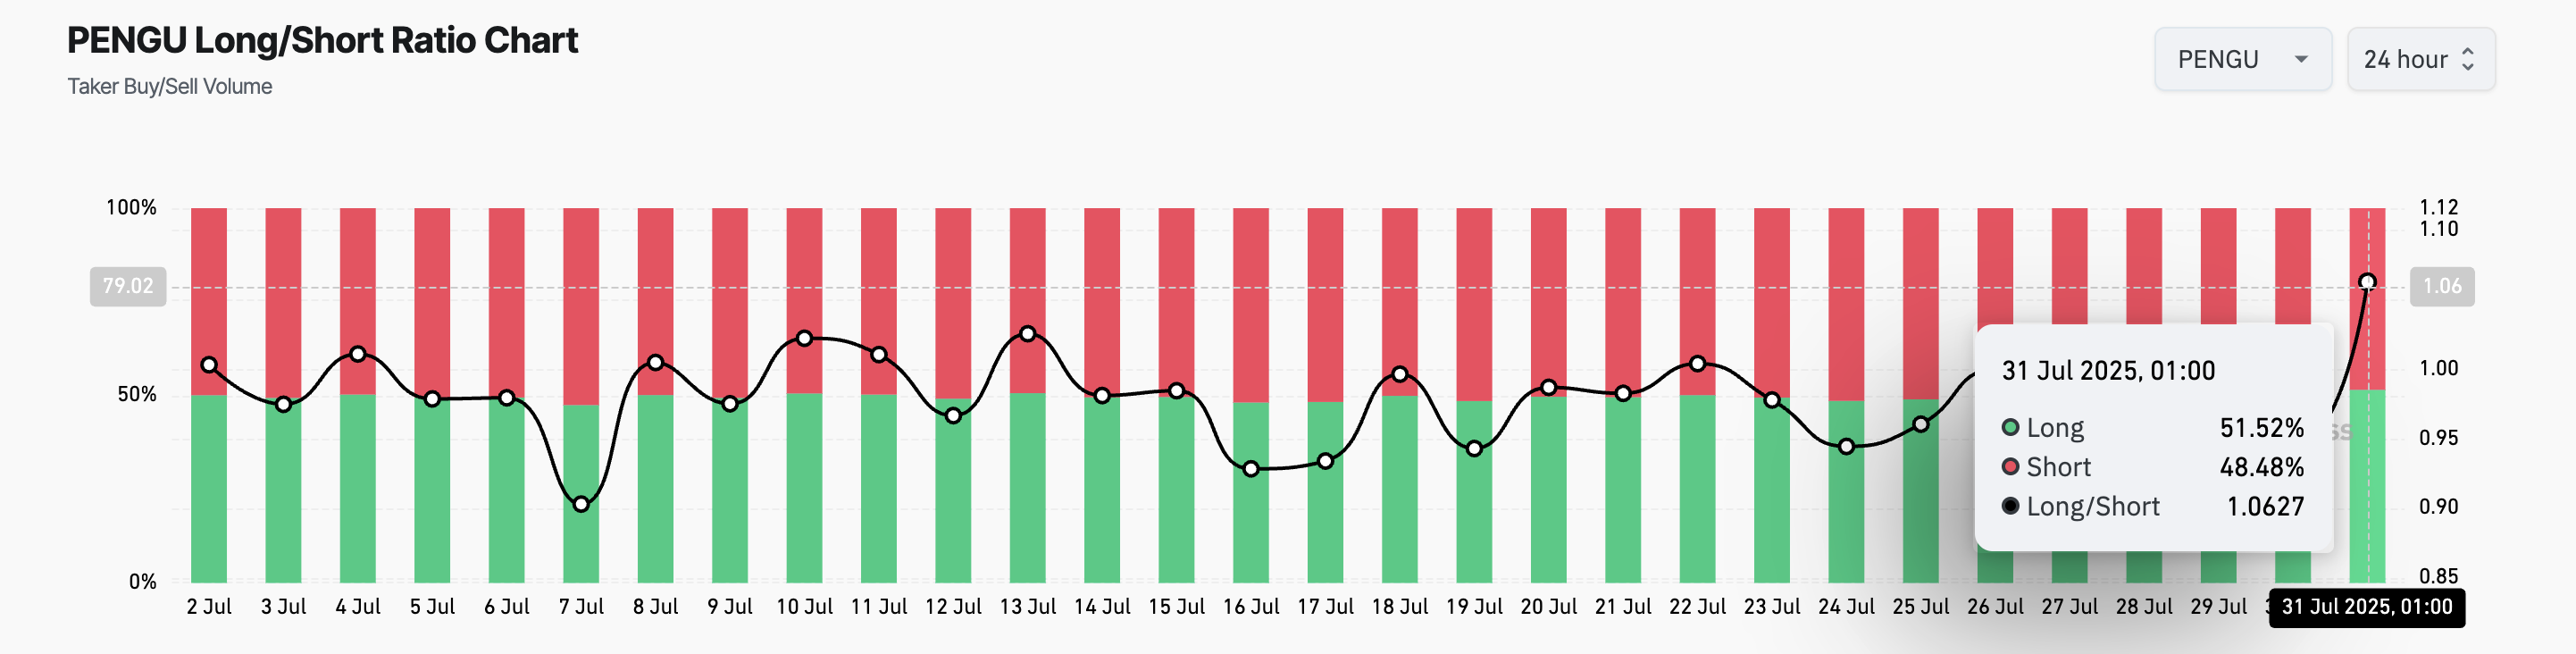
The long/short ratio measures the proportion of open long positions (bets that the price will go up) to open short positions (bets that the price will fall) across futures markets.
A ratio above 1 indicates that more traders are taking long positions than short ones. In PENGU’s case, it signals that market participants are increasingly positioning themselves for further upside.
PENGU’s Tug-of-War Near Support Could Decide Next Big Move
At the time of writing, PENGU trades at $0.0379, holding steady above the support floor at $0.0369. If buying momentum continues to build, the meme coin could rally toward the $0.044 region, NEAR where liquidity clusters are positioned.
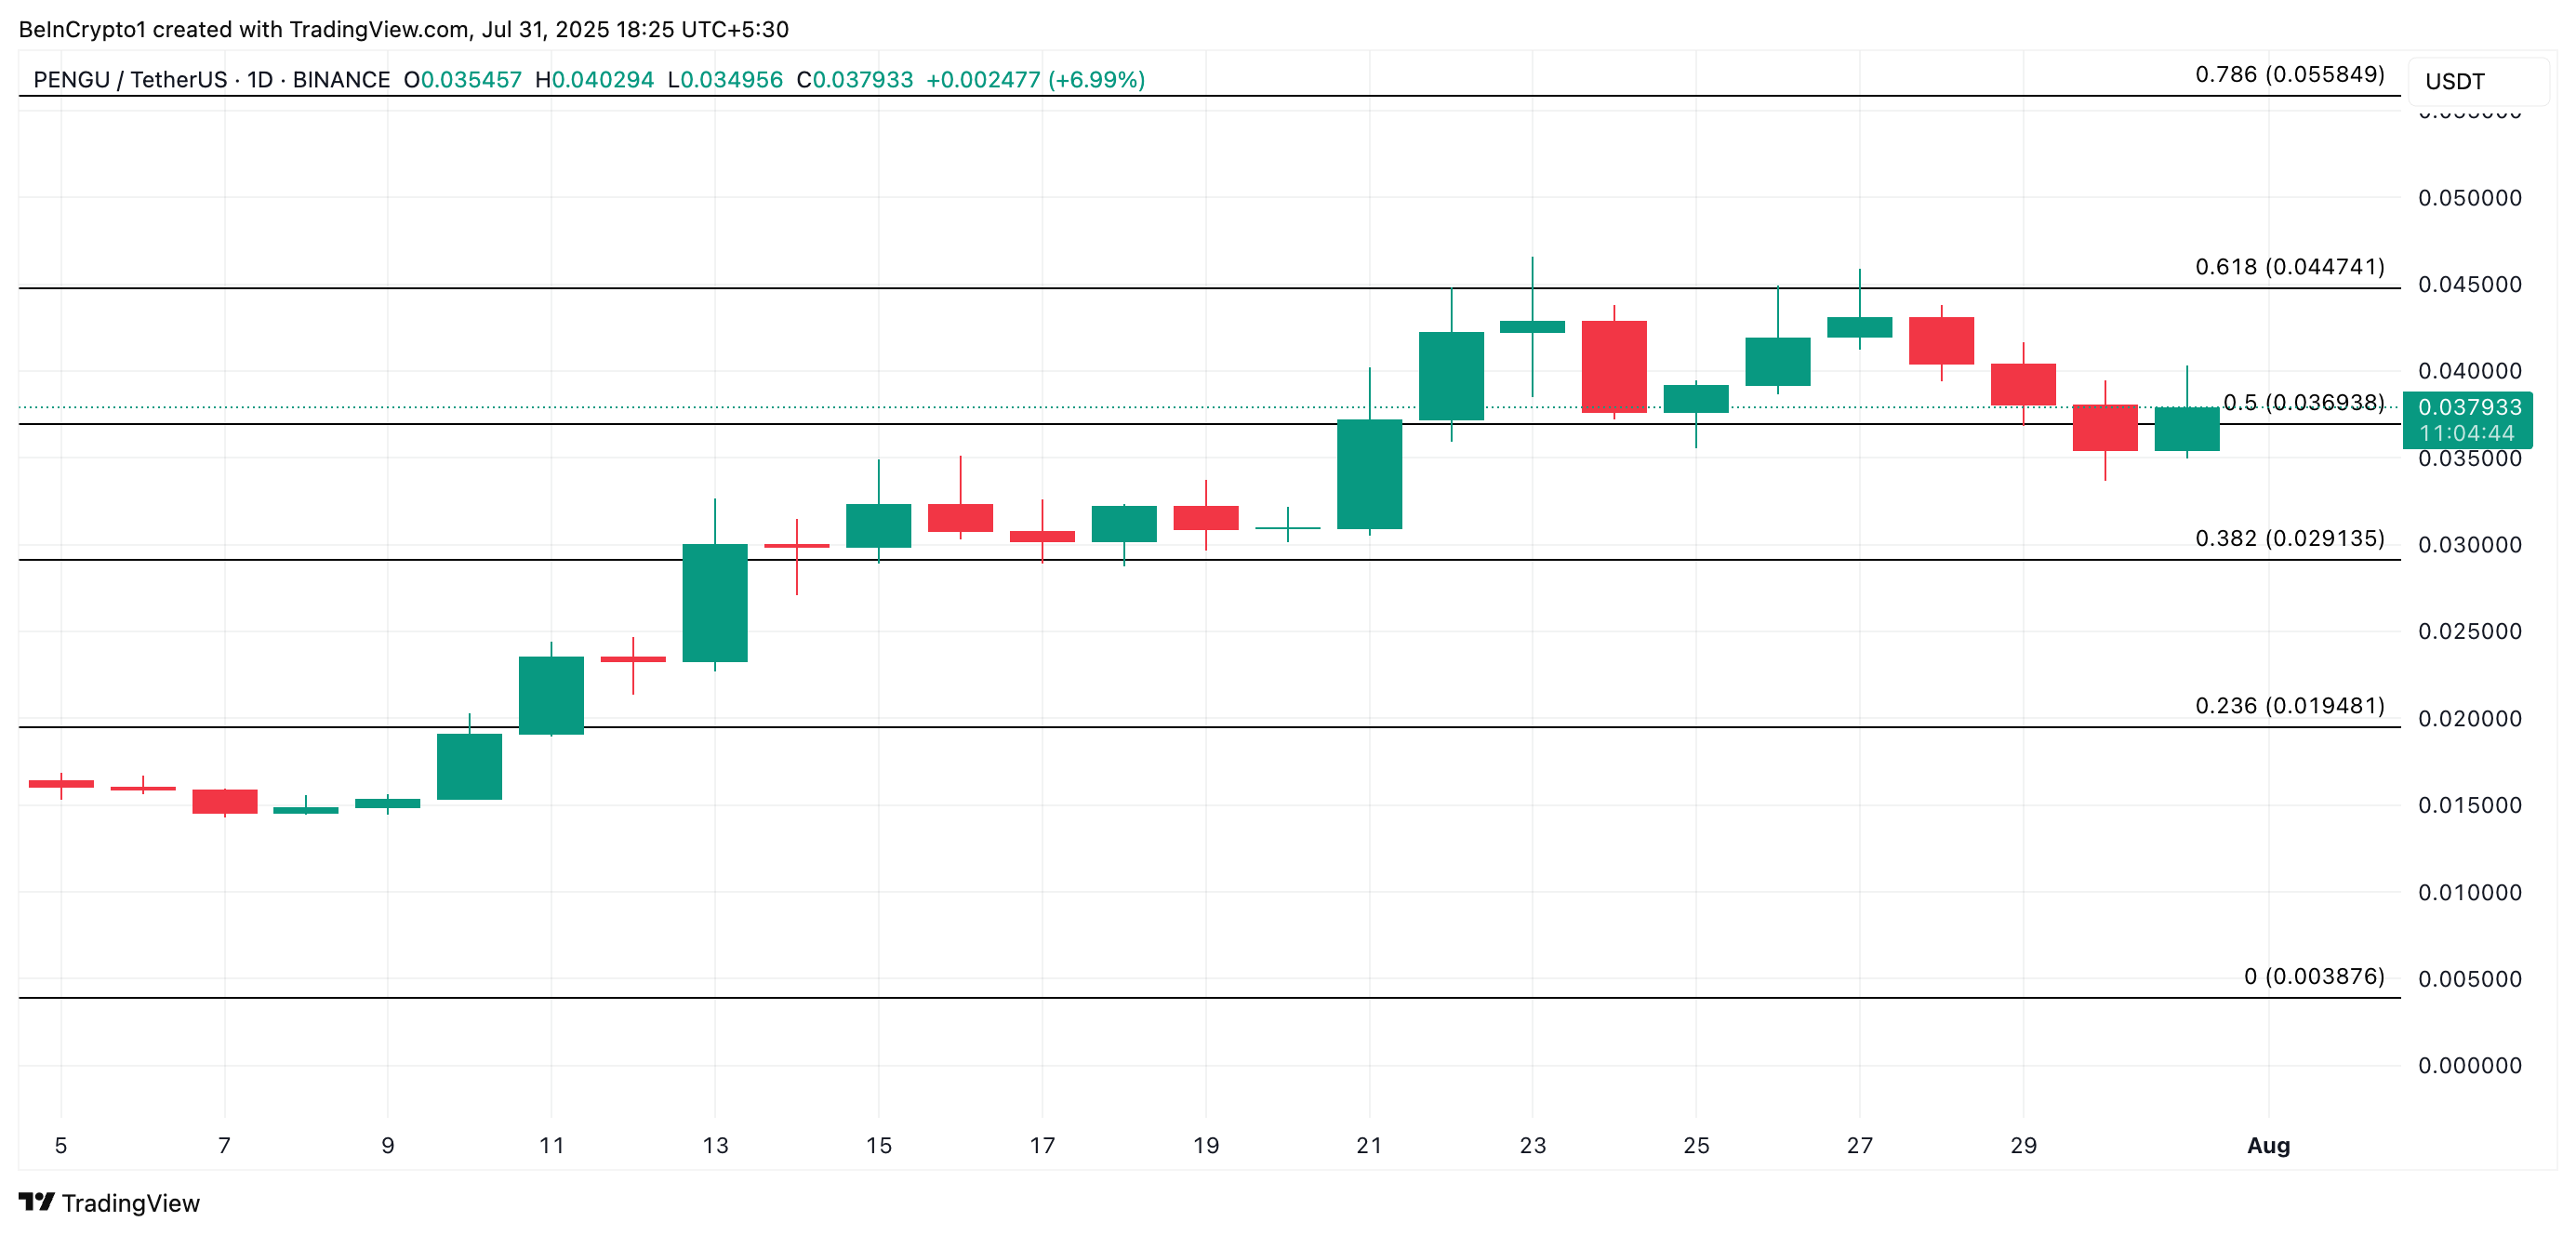
However, if bearish pressure reemerges, a breakdown below the $0.0369 support could open the door for a deeper retracement toward the $0.0291 zone.
