Hedera (HBAR) Price in August 2025: Bullish Breakout or Bearish Reality Check?

Hedera (HBAR) hits a critical inflection point as August 2025 kicks off—will institutional adoption fuel its ascent, or will macro headwinds slam the brakes?
The Bull Case: Enterprise Adoption Accelerates
With Fortune 500 giants now running mission-critical DApps on Hedera's enterprise-grade DAG, HBAR's tokenomics could finally get the traction they deserve. Network activity metrics suggest institutions aren't just dipping toes—they're diving in headfirst.
Technical Outlook: Breaking Resistance or Faking Out?
HBAR's chart shows a textbook pennant formation after last month's 40% surge. Traders are split: either we're witnessing consolidation before a run at all-time highs, or another 'buy the rumor, sell the news' trap for retail bagholders.
Macro Wildcards: The Fed's Shadow Looms
As the SEC quietly shelves its war on altcoins (to focus on crushing smaller banks instead), HBAR's fate now hinges on whether Jerome Powell keeps playing inflation whack-a-mole with rate hikes.
One thing's certain—by August 2025, Hedera will either be the blockchain darling Wall Street never saw coming, or another cautionary tale about 'enterprise-ready' tokens that forgot retail investors exist.
August History Hints At A Shaky Month
Looking back at the monthly returns chart, August has only delivered a strong green close once in 2021, while most other years ended flat or negative.
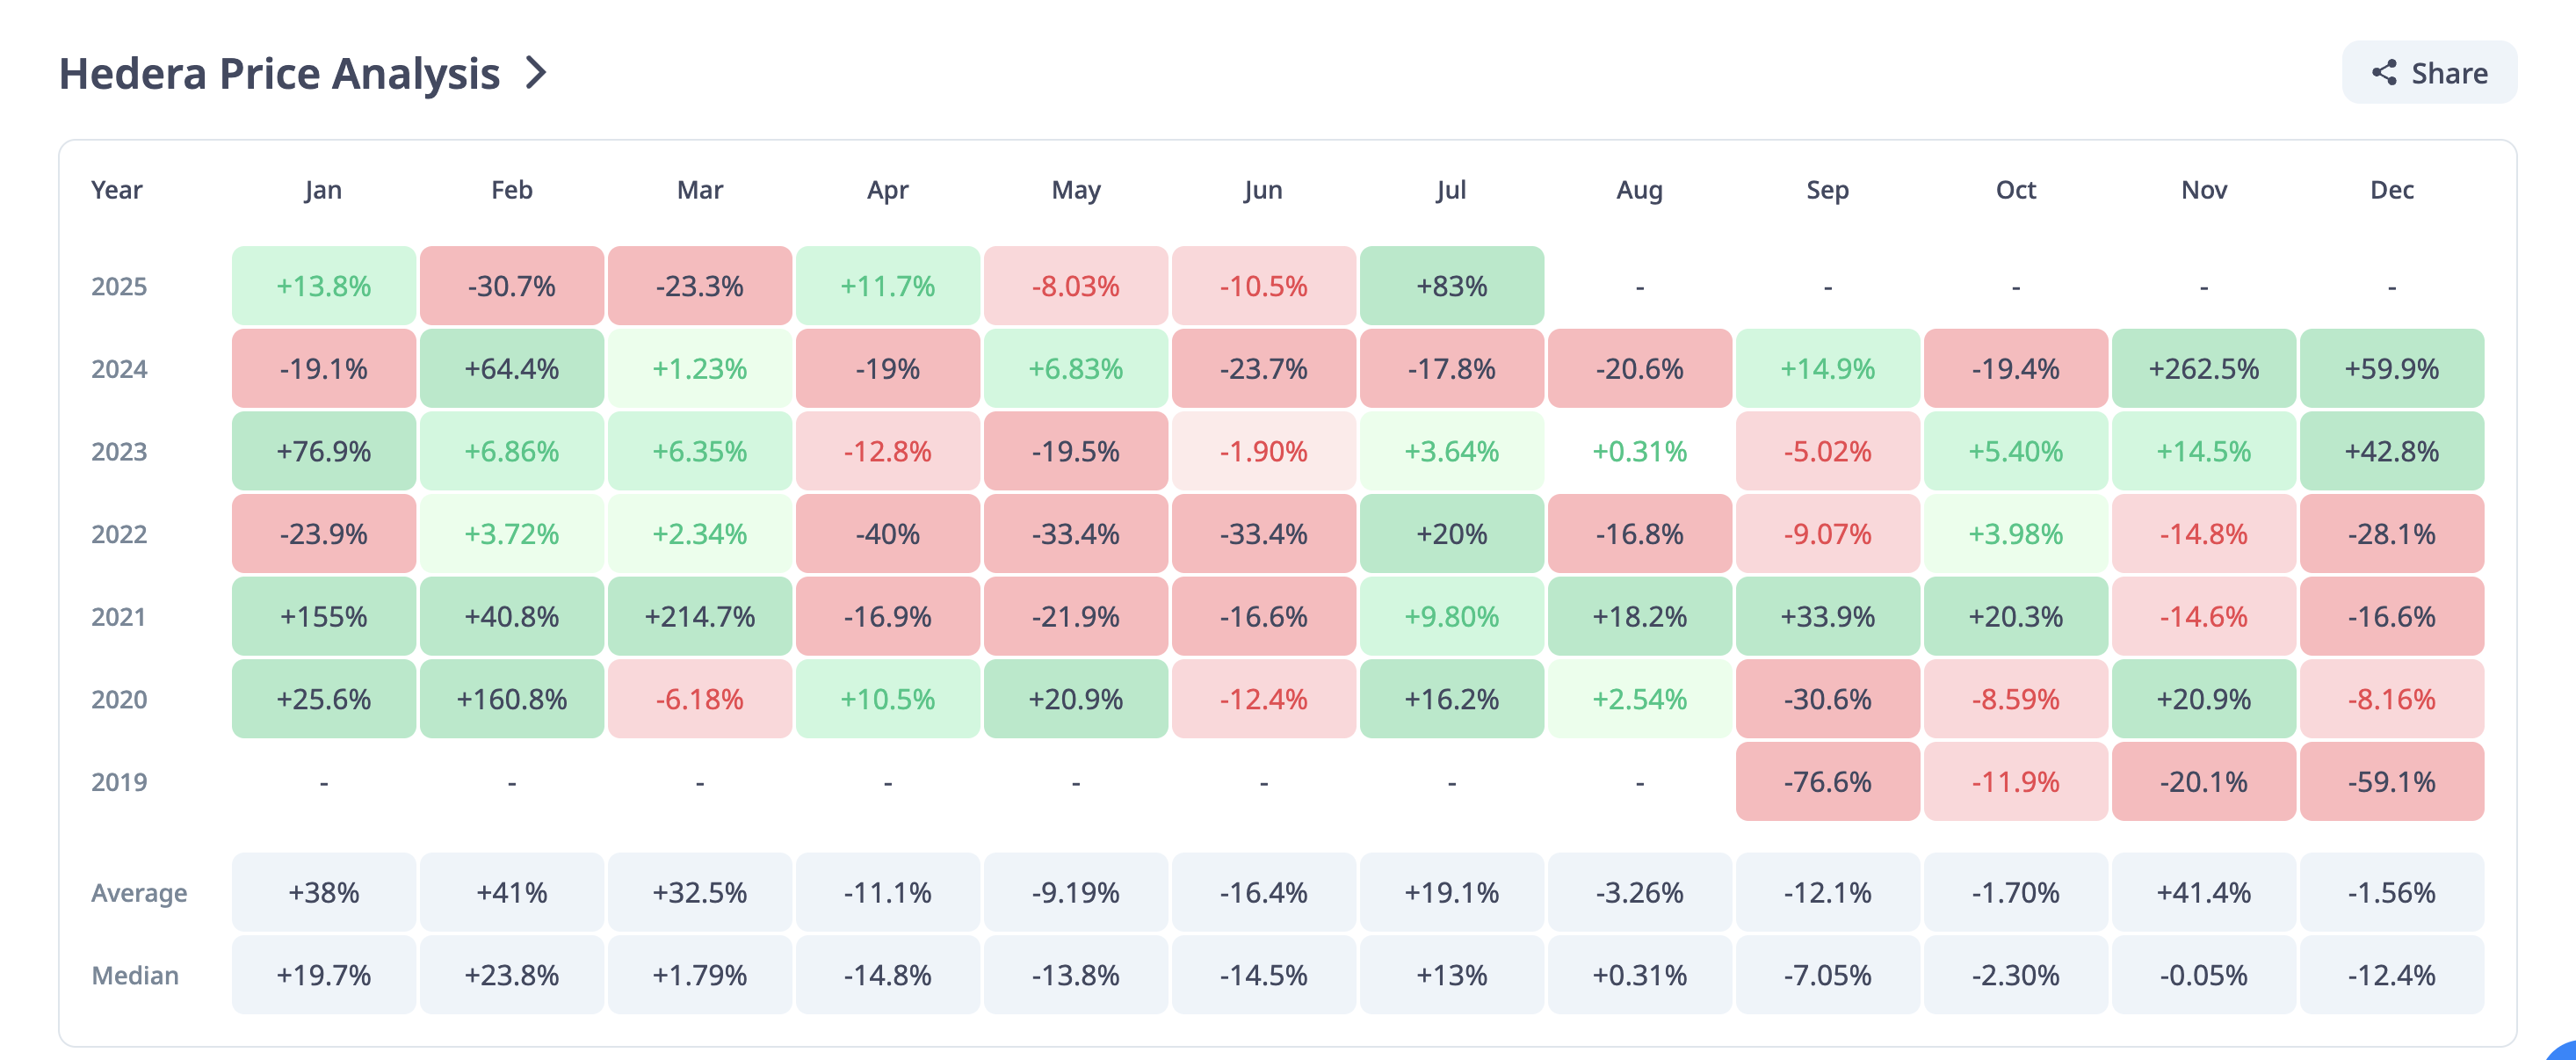
That backdrop sets a cautious tone for traders heading into this month. Even after July’s surge, history suggests the HBAR price rally could cool, especially if profit-taking kicks in.
Hedera Whales Keep Buying, But Upside Is Getting Crowded
On-chain data shows large holders with 1 million+ HBAR tokens increased their share from 64% to 77% in July, while 10 million+ token whales reached 96% of the total supply.
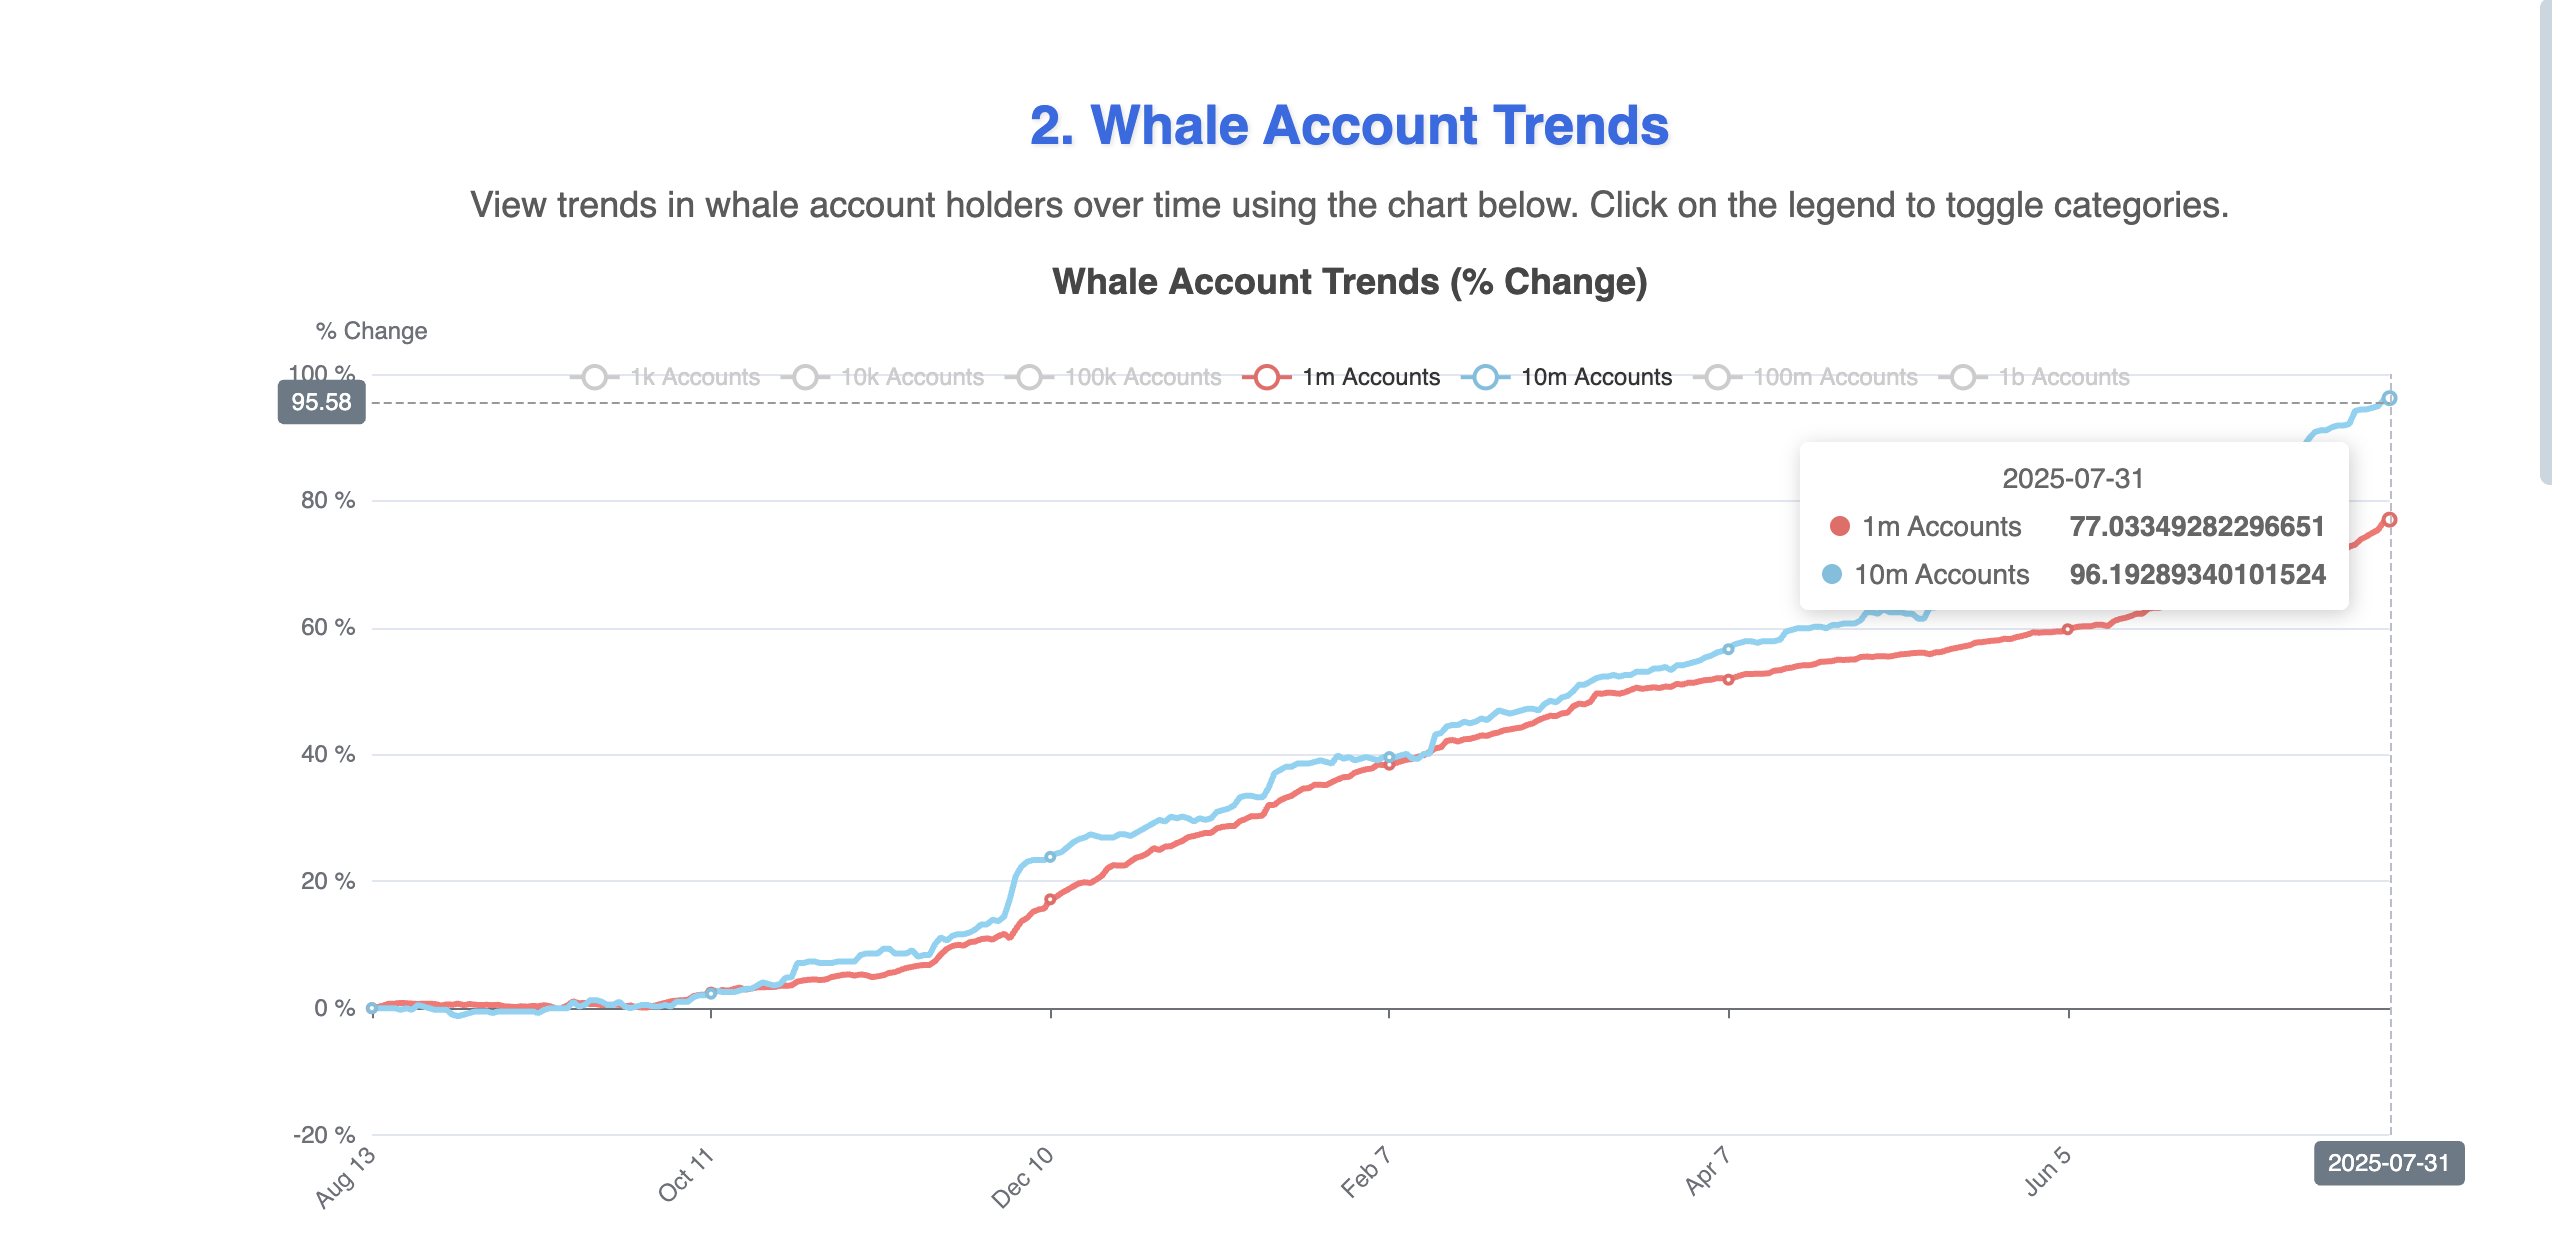
This steady accumulation has been a key driver of July’s gains. However, with whales already heavily allocated, there might be limited fresh capital left to sustain the same pace in August. Or they might again want to step in once the price starts dipping!
Any slowdown in whale buying could open the door for a pullback.
: Want more token insights like this? Sign up for Editor Harsh Notariya’s Daily crypto Newsletter here.
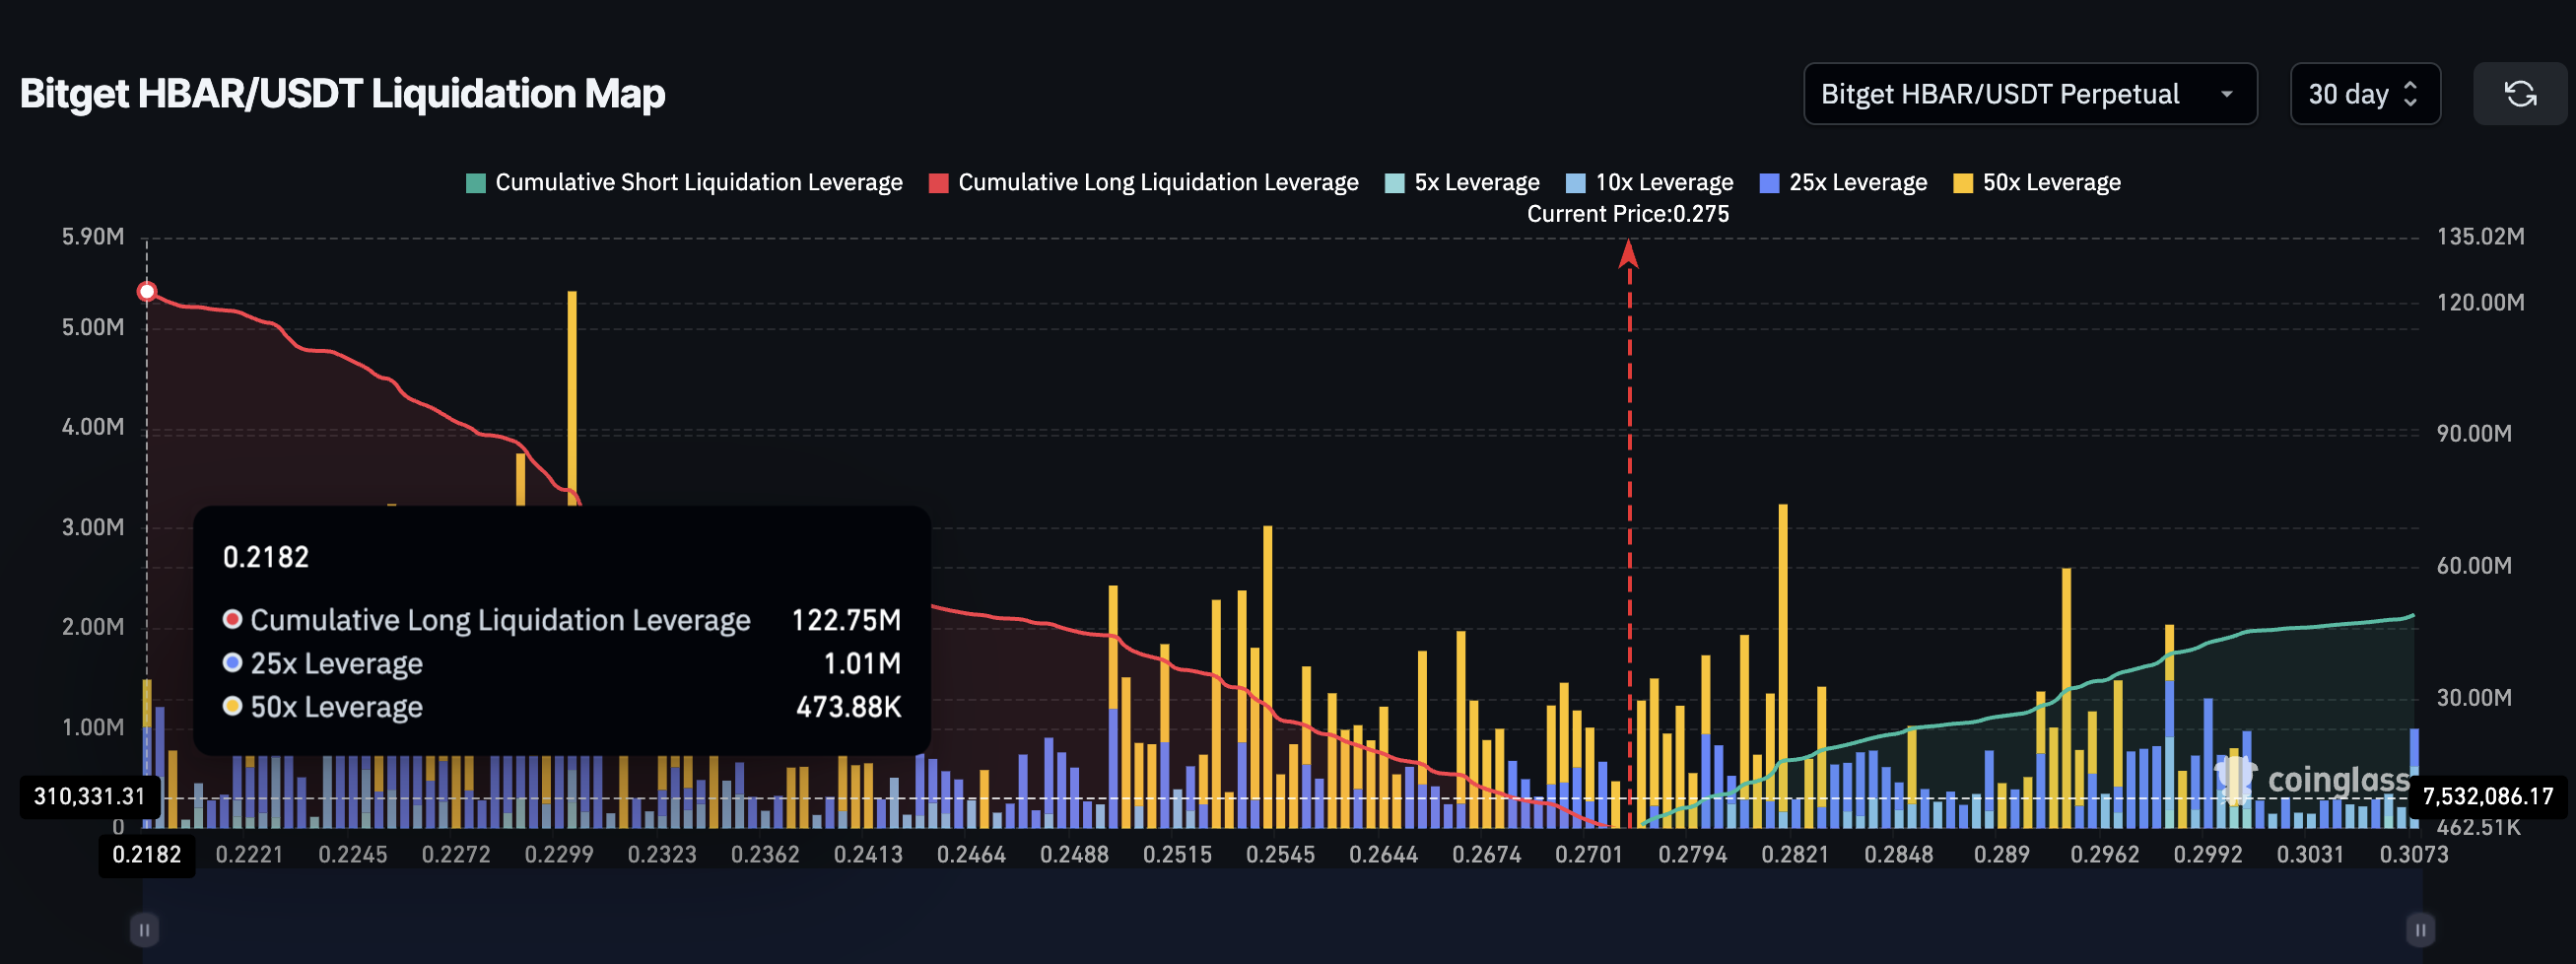
Derivatives Positioning, OBV, And Bull-Bear Sentiment Are Mildly Bullish
The Bitget liquidation map shows long leverage vastly outweighing shorts ($122.75 million vs. $49 million), meaning the market is still positioned for upside. This skew adds risk: if price drops, liquidation clusters NEAR $0.2182 could accelerate selling.
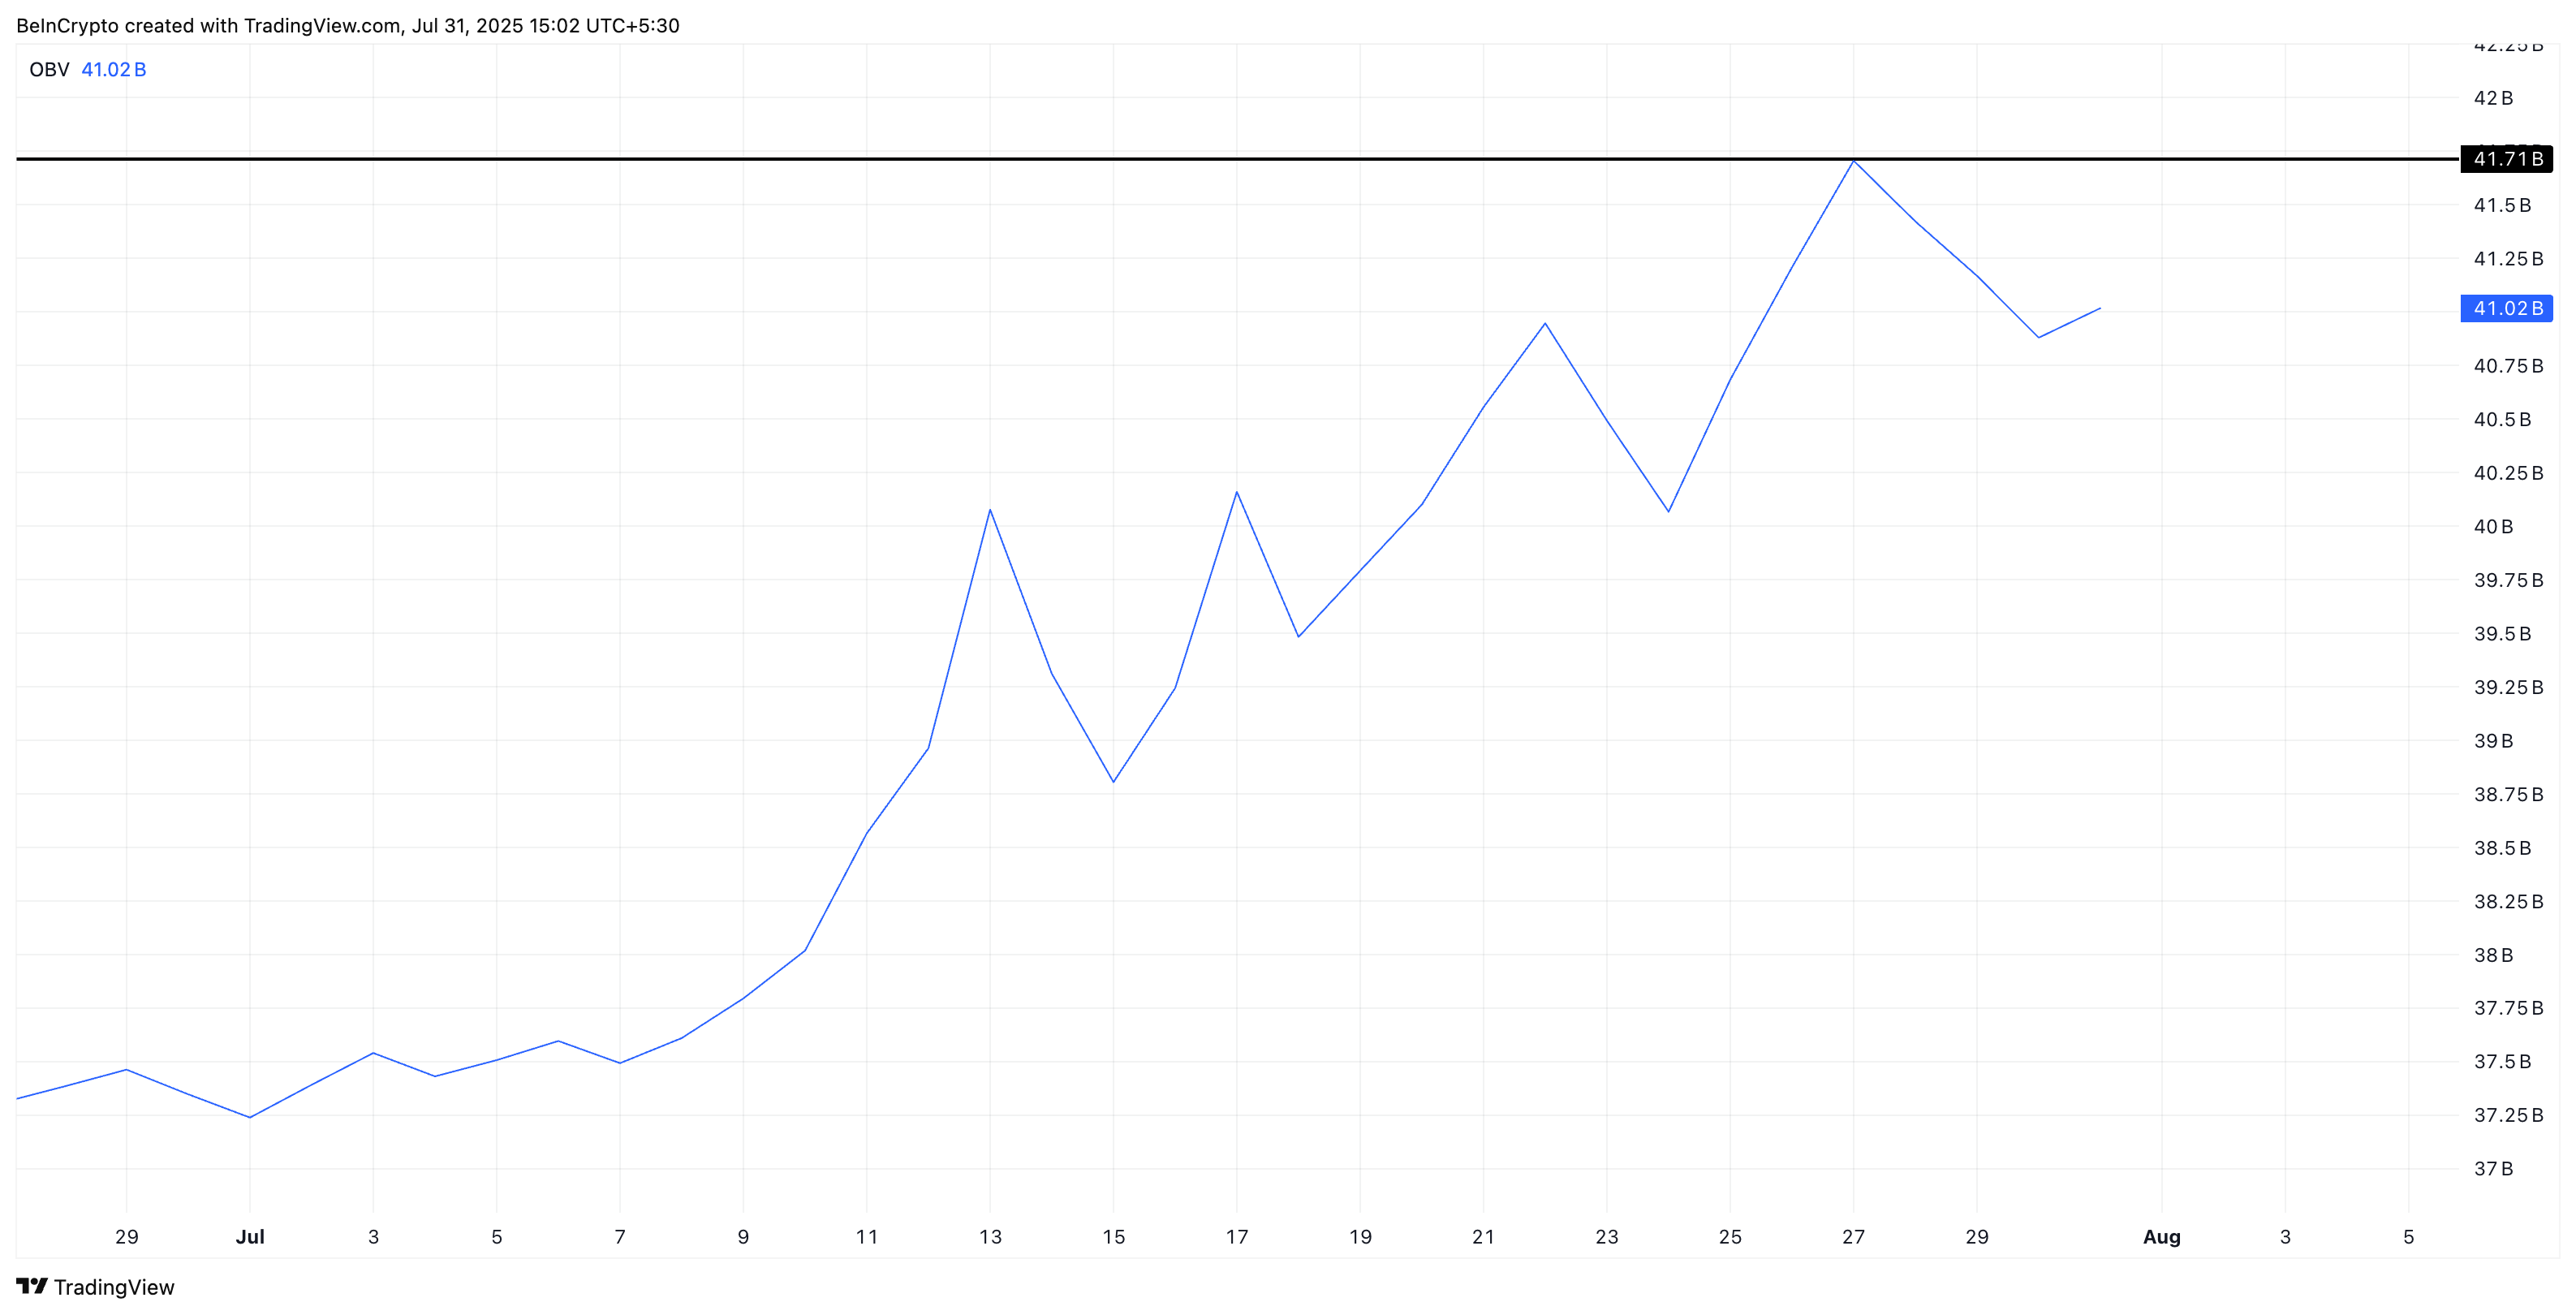
Meanwhile, On-Balance Volume (OBV) continues to trend upward, confirming that buying activity is still outweighing selling activity overall. However, even though OBV is making higher highs, it needs to stay above the 41.71 billion mark to sustain the HBAR price momentum in August.
On-Balance Volume (OBV) is a momentum indicator that tracks cumulative trading volume to show whether buying or selling pressure is dominating. A rising OBV suggests buyers are in control, while a falling OBV signals increasing sell pressure.
The Bull-Bear Power (BBP) indicator, which measures whether bulls or bears have stronger momentum, briefly turned negative in a single session last week but quickly flipped back green.
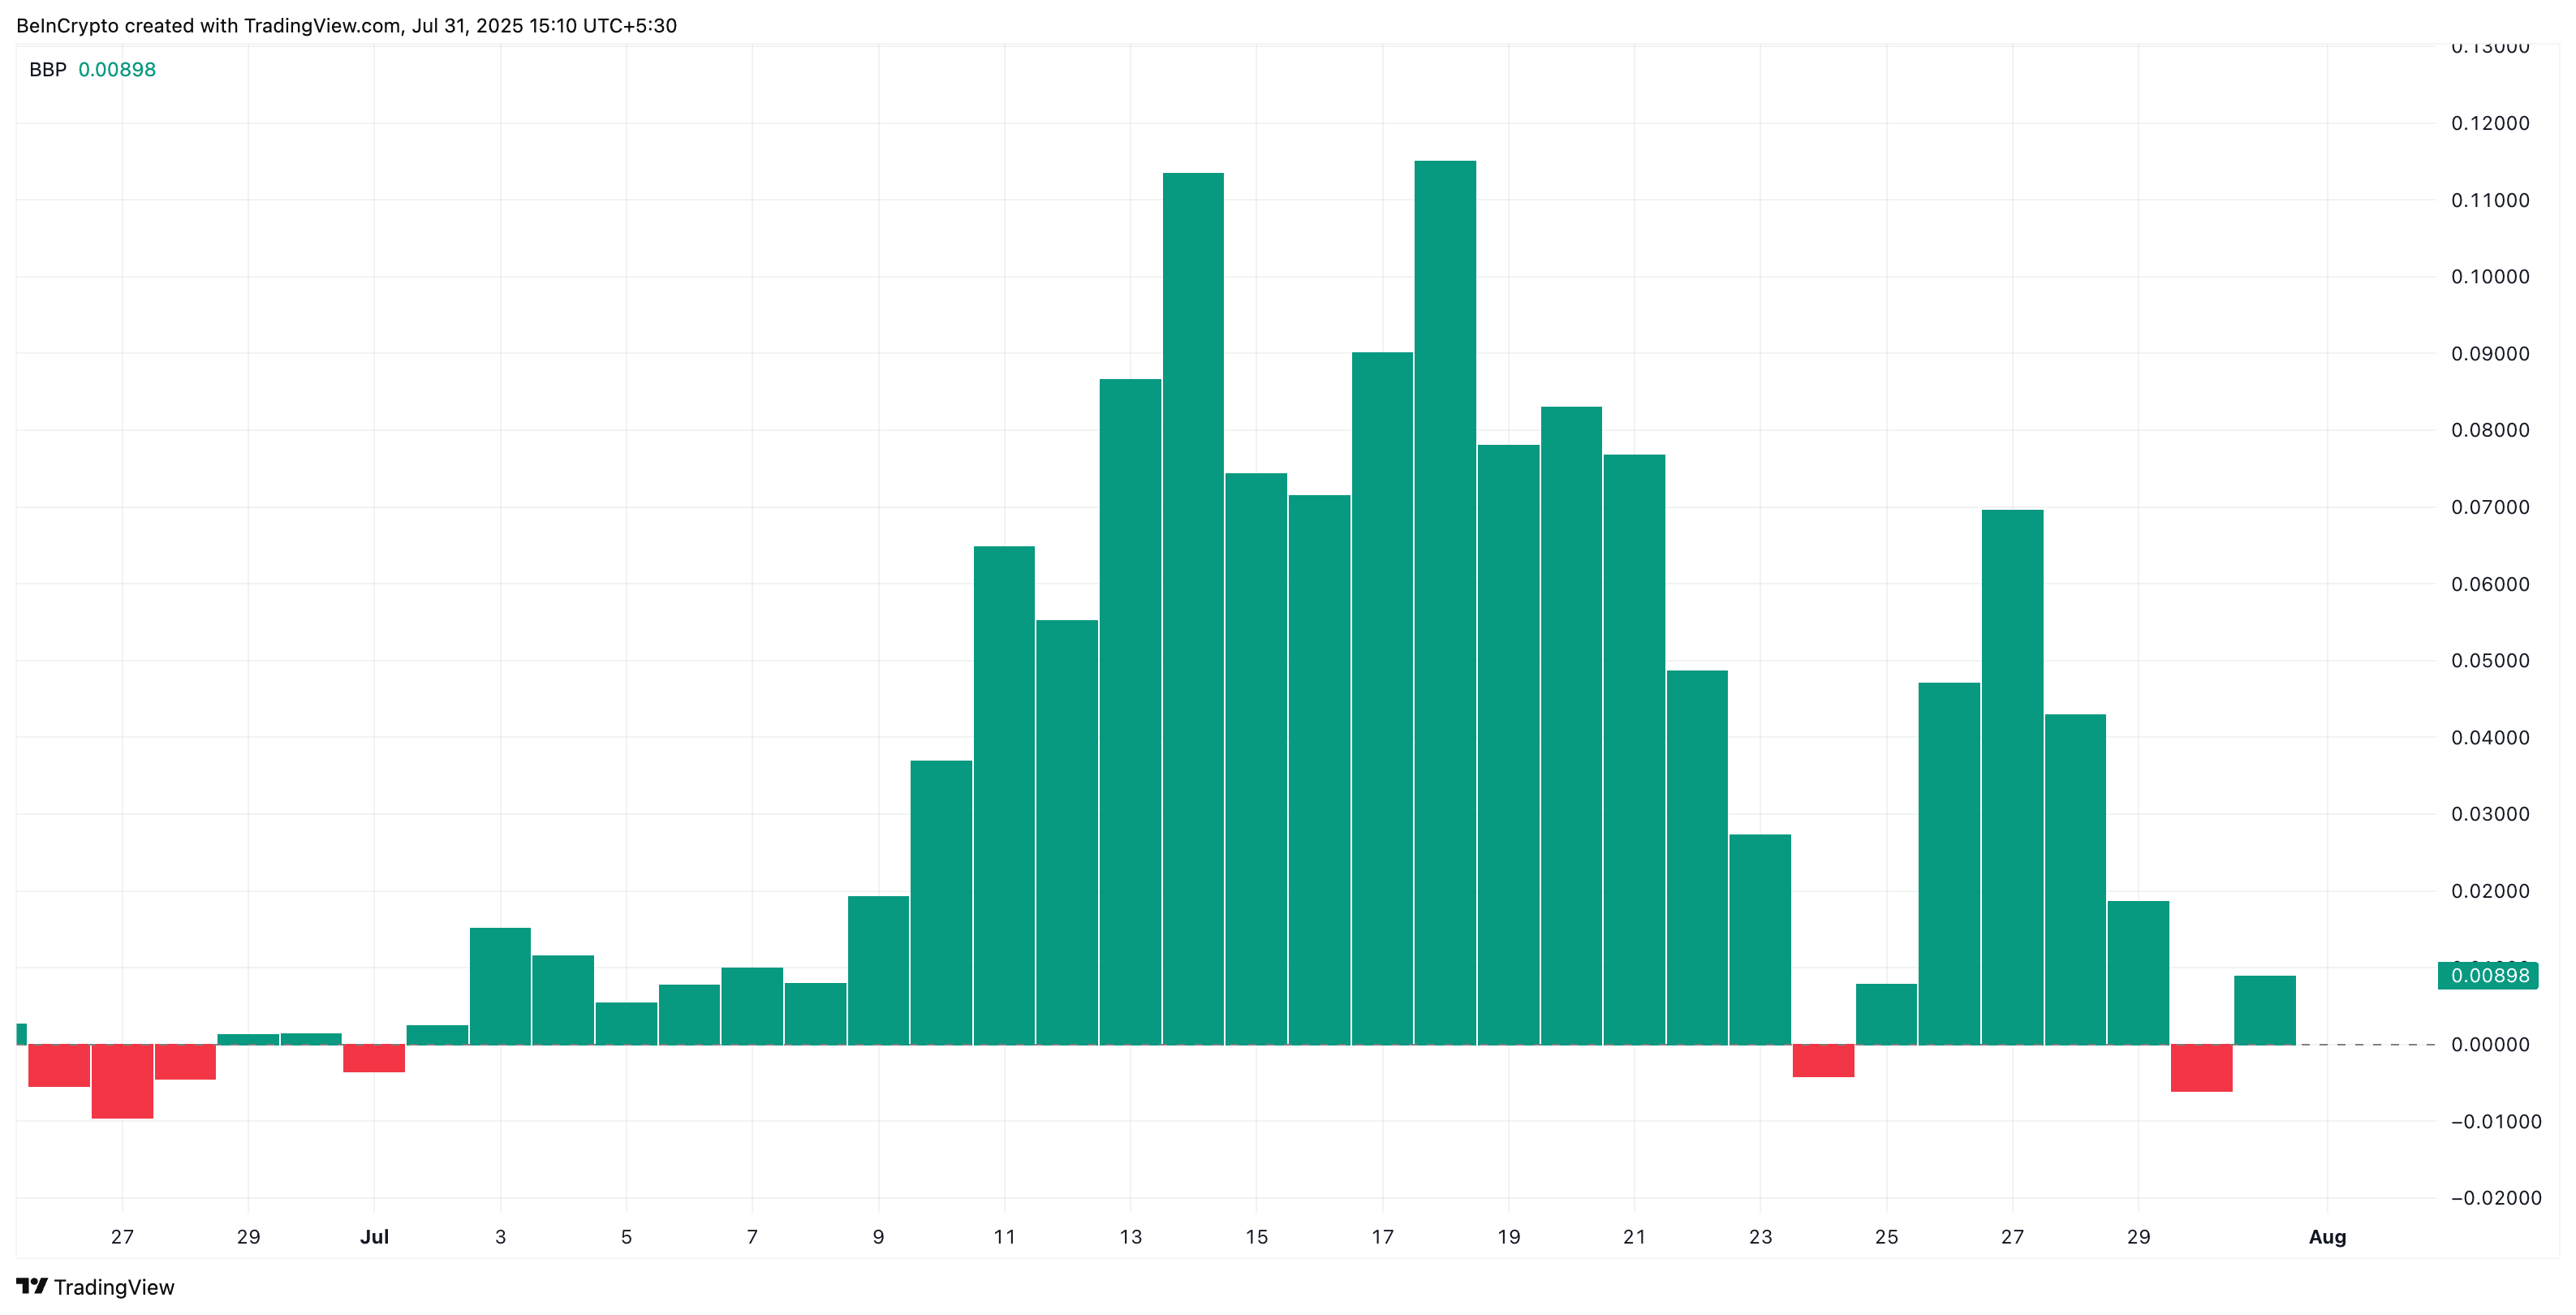
This shows bulls are holding control for now, but the grip is not unshakable. Hence, caution ahead!
HBAR Price Structure Tussles Between Weekly Triangle And Daily Supports: Who Wins?
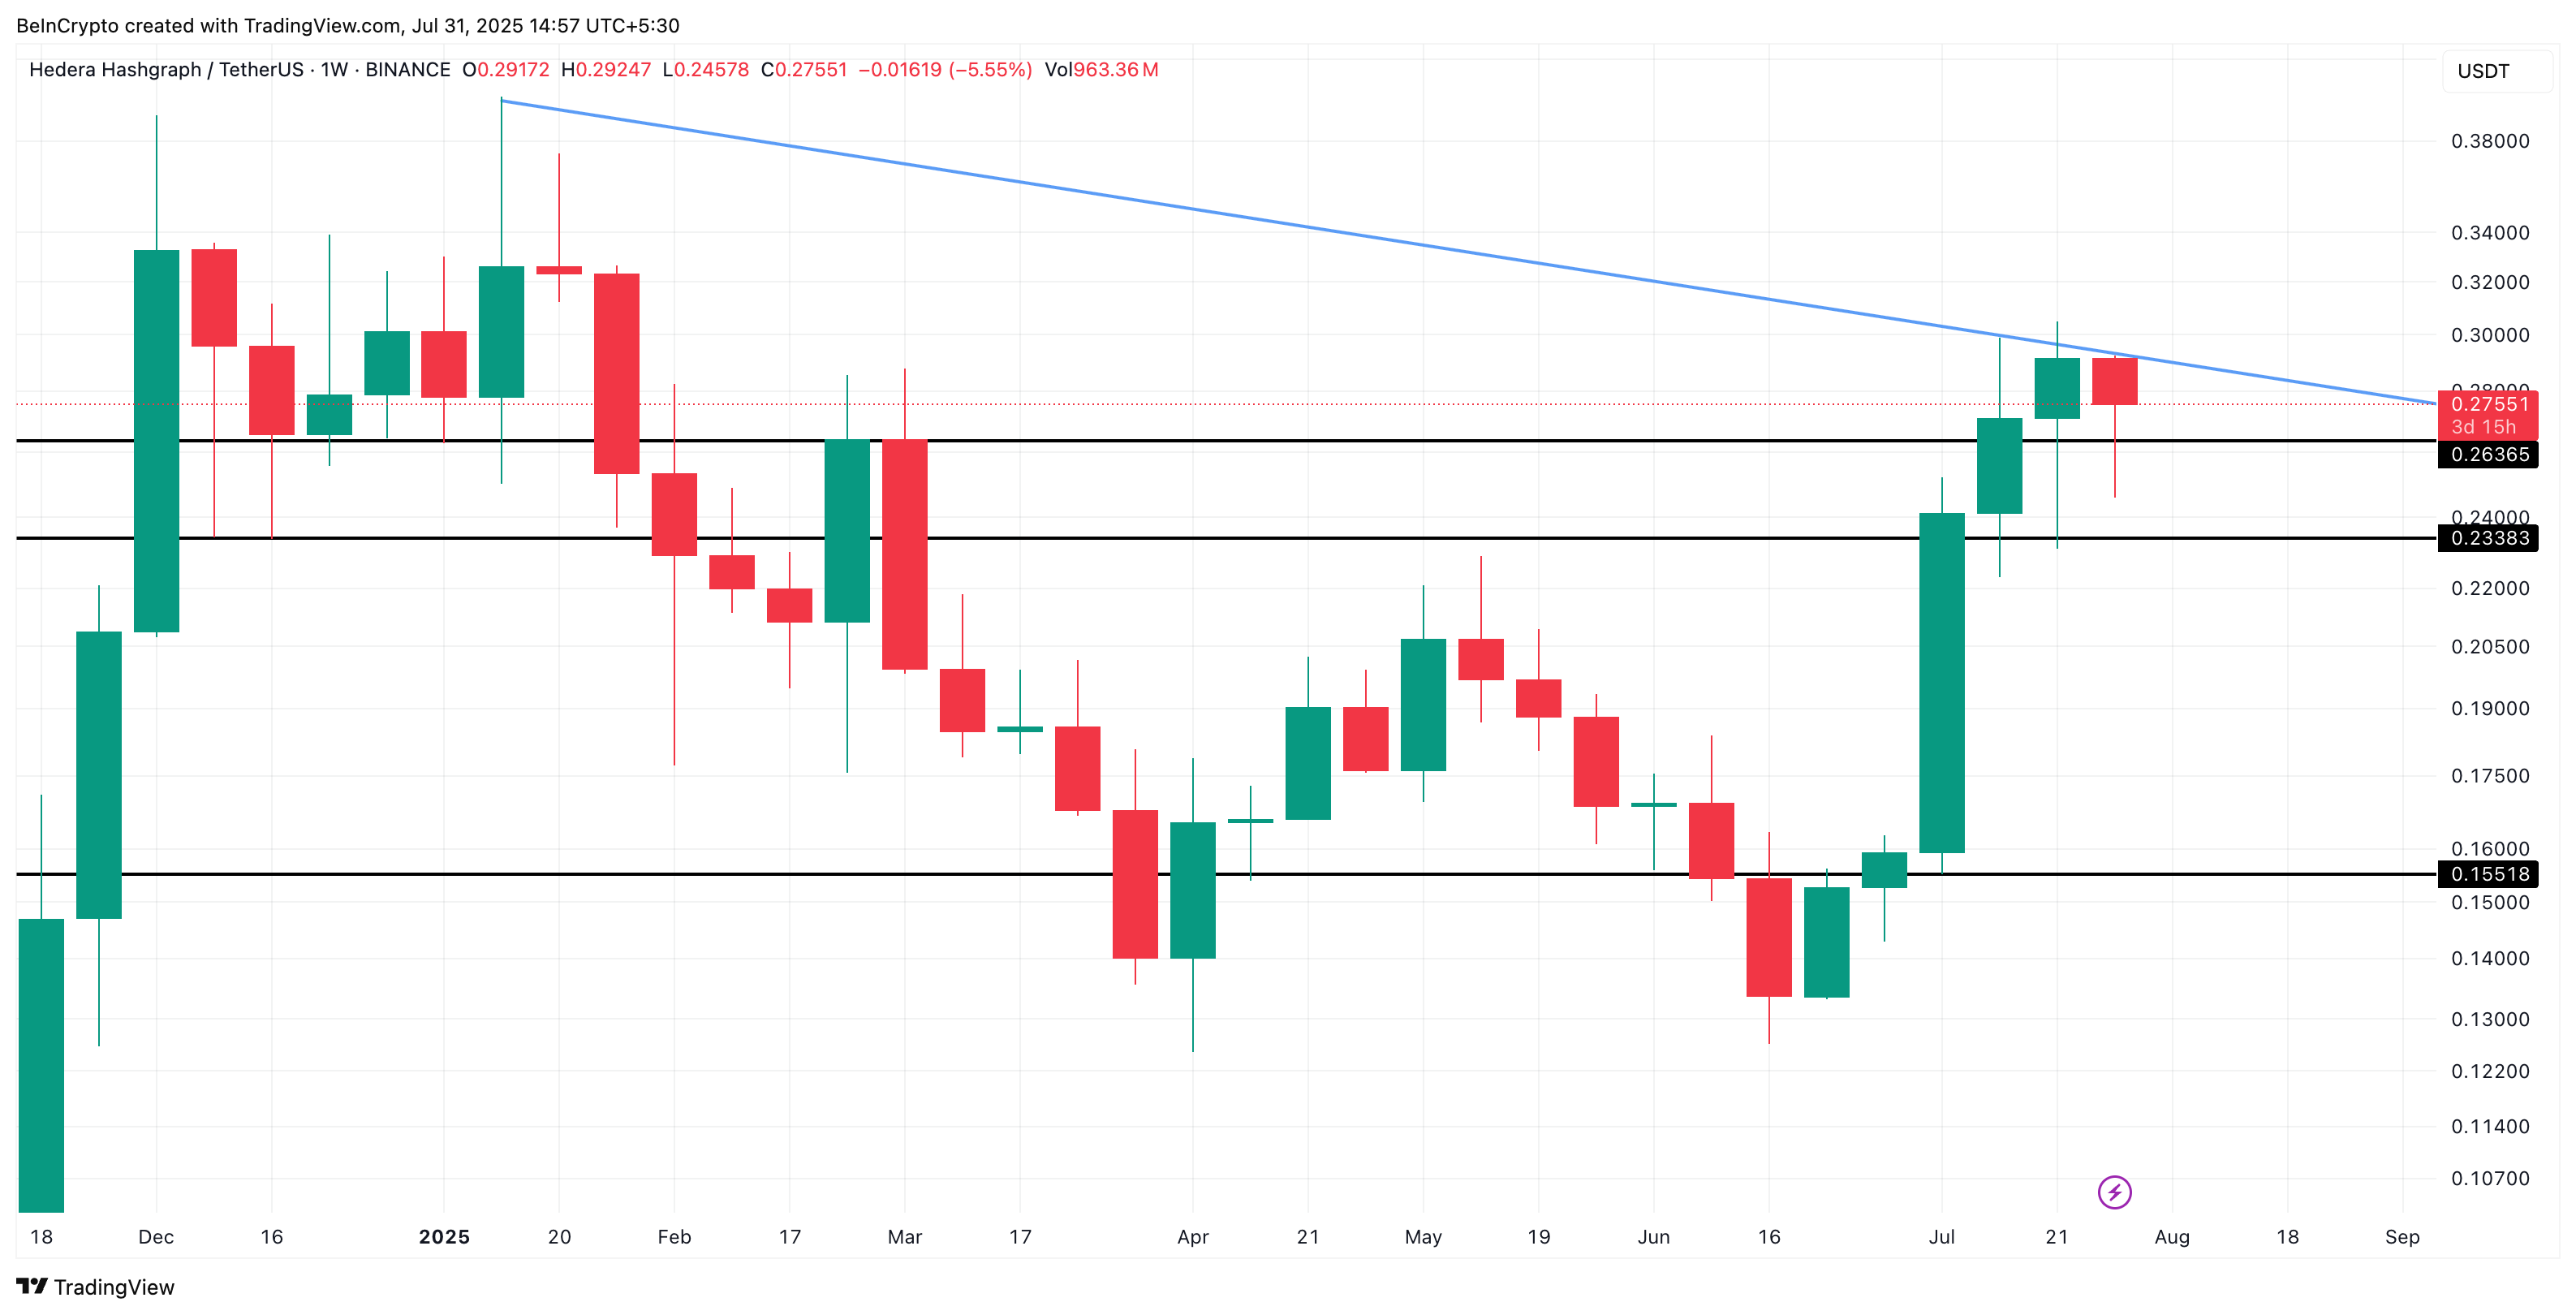
The weekly chart paints a mixed picture, with HBAR consolidating inside a descending triangle, a formation that typically leans bearish even during an uptrend. If price fails to break above the triangle’s upper trendline near $0.30, history suggests August could bring a correction.
At present, two levels, $0.26 and $0.23, are lending support. If they break, the entire structure might turn bearish, rather quickly.
On the daily chart, Fibonacci retracement levels highlight the key battlegrounds.
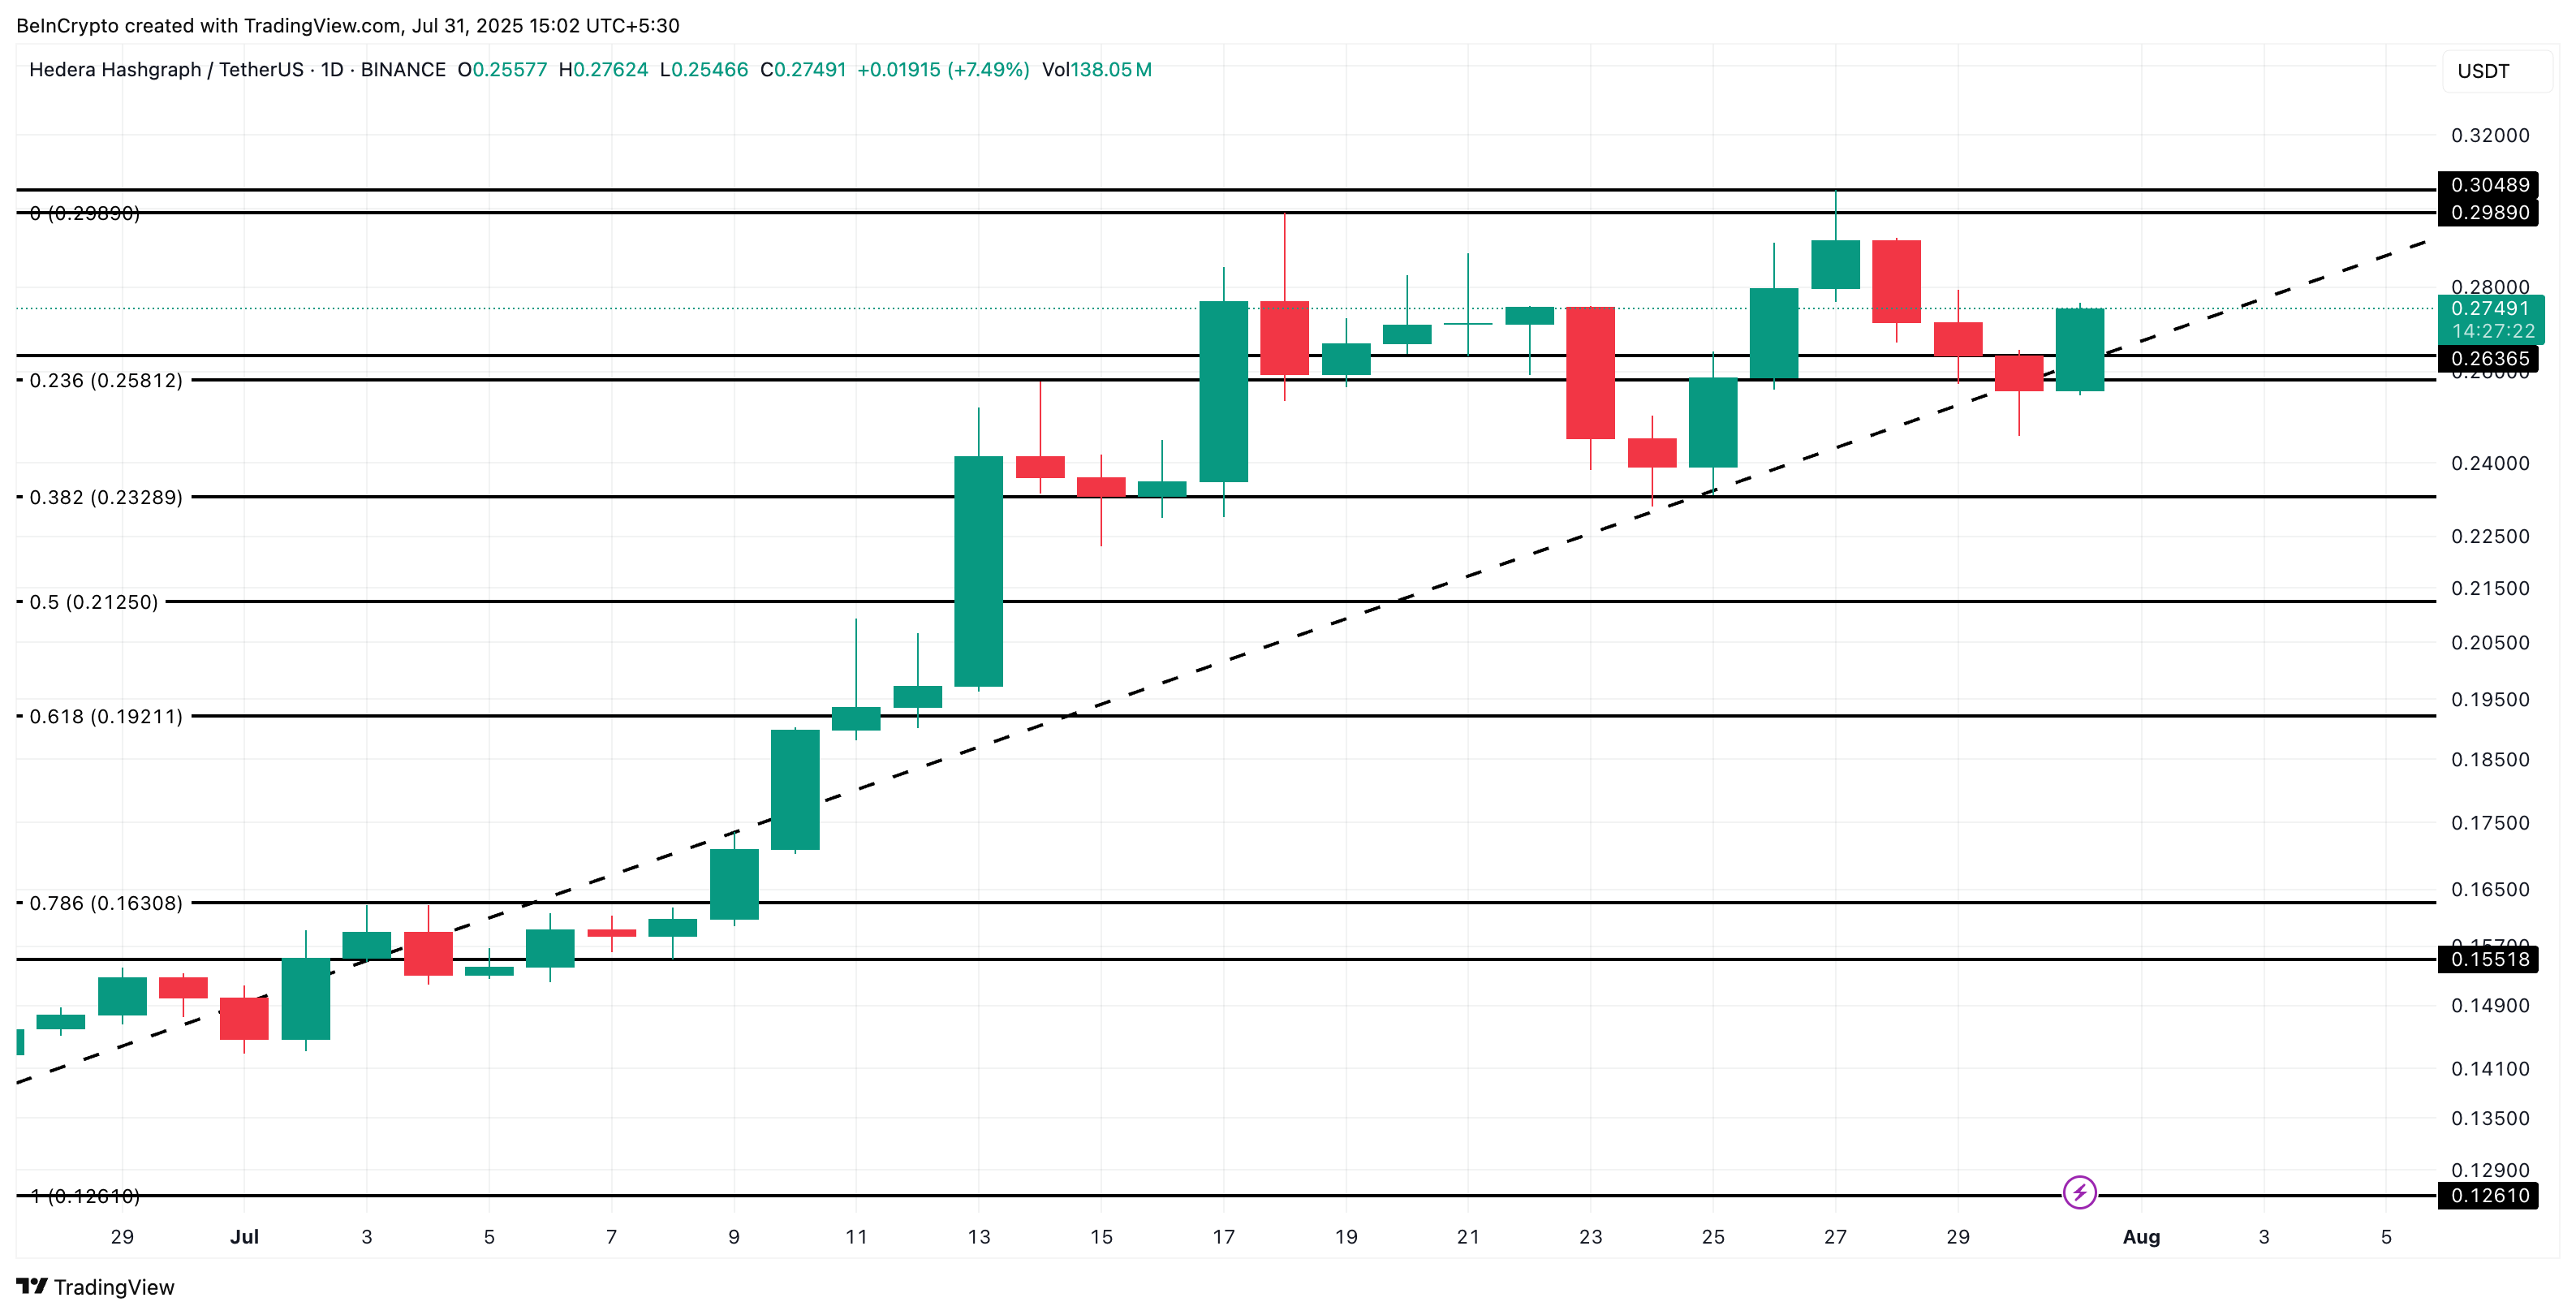
Immediate support sits at $0.26 (same as the weekly chart), followed by $0.23 and $0.21. If bulls defend these zones, a retest of $0.29–$ 0.30 remains possible. A clean breakout above $0.30 WOULD be the clearest sign that August could defy its bearish history.
