Hedera (HBAR) Teeters on Edge—Is a Stunning Reversal Imminent?

Hedera's HBAR flirts with breakdown territory—but don't write its obituary yet. The DLT dark horse might be loading a bullish trap.
Technical Setup: The knife catches hands
HBAR's chart paints a classic 'falling knife' pattern—yet volume tells a sneaky counter-narrative. Whale accumulation spikes while retail panics? Cue the cynical Wall Street adage: 'The dumb money sells what the smart money buys.'
Network fundamentals defy price action
Enterprise adoption metrics keep climbing like a silent assassin. Mainnet activity? Steady. Developer commits? Up. But hey—since when did crypto prices actually reflect utility? (That's your finance jab, served cold.)
Make-or-break levels to watch
Hold $0.08 and we're looking at a potential springboard. Break $0.12? The shorts get steamrolled. Either way—grab popcorn. This could get violent.
Hedera’s HBAR Faces Breakdown
Readings from the HBAR/USD one-day chart show the altcoin trading NEAR its 20-day exponential moving average (EMA). With climbing sell-side pressure, a breach below this key support floor formed at $0.22 appears likely over the next few trading sessions.
: Want more token insights like this? Sign up for Editor Harsh Notariya’s Daily crypto Newsletter here.
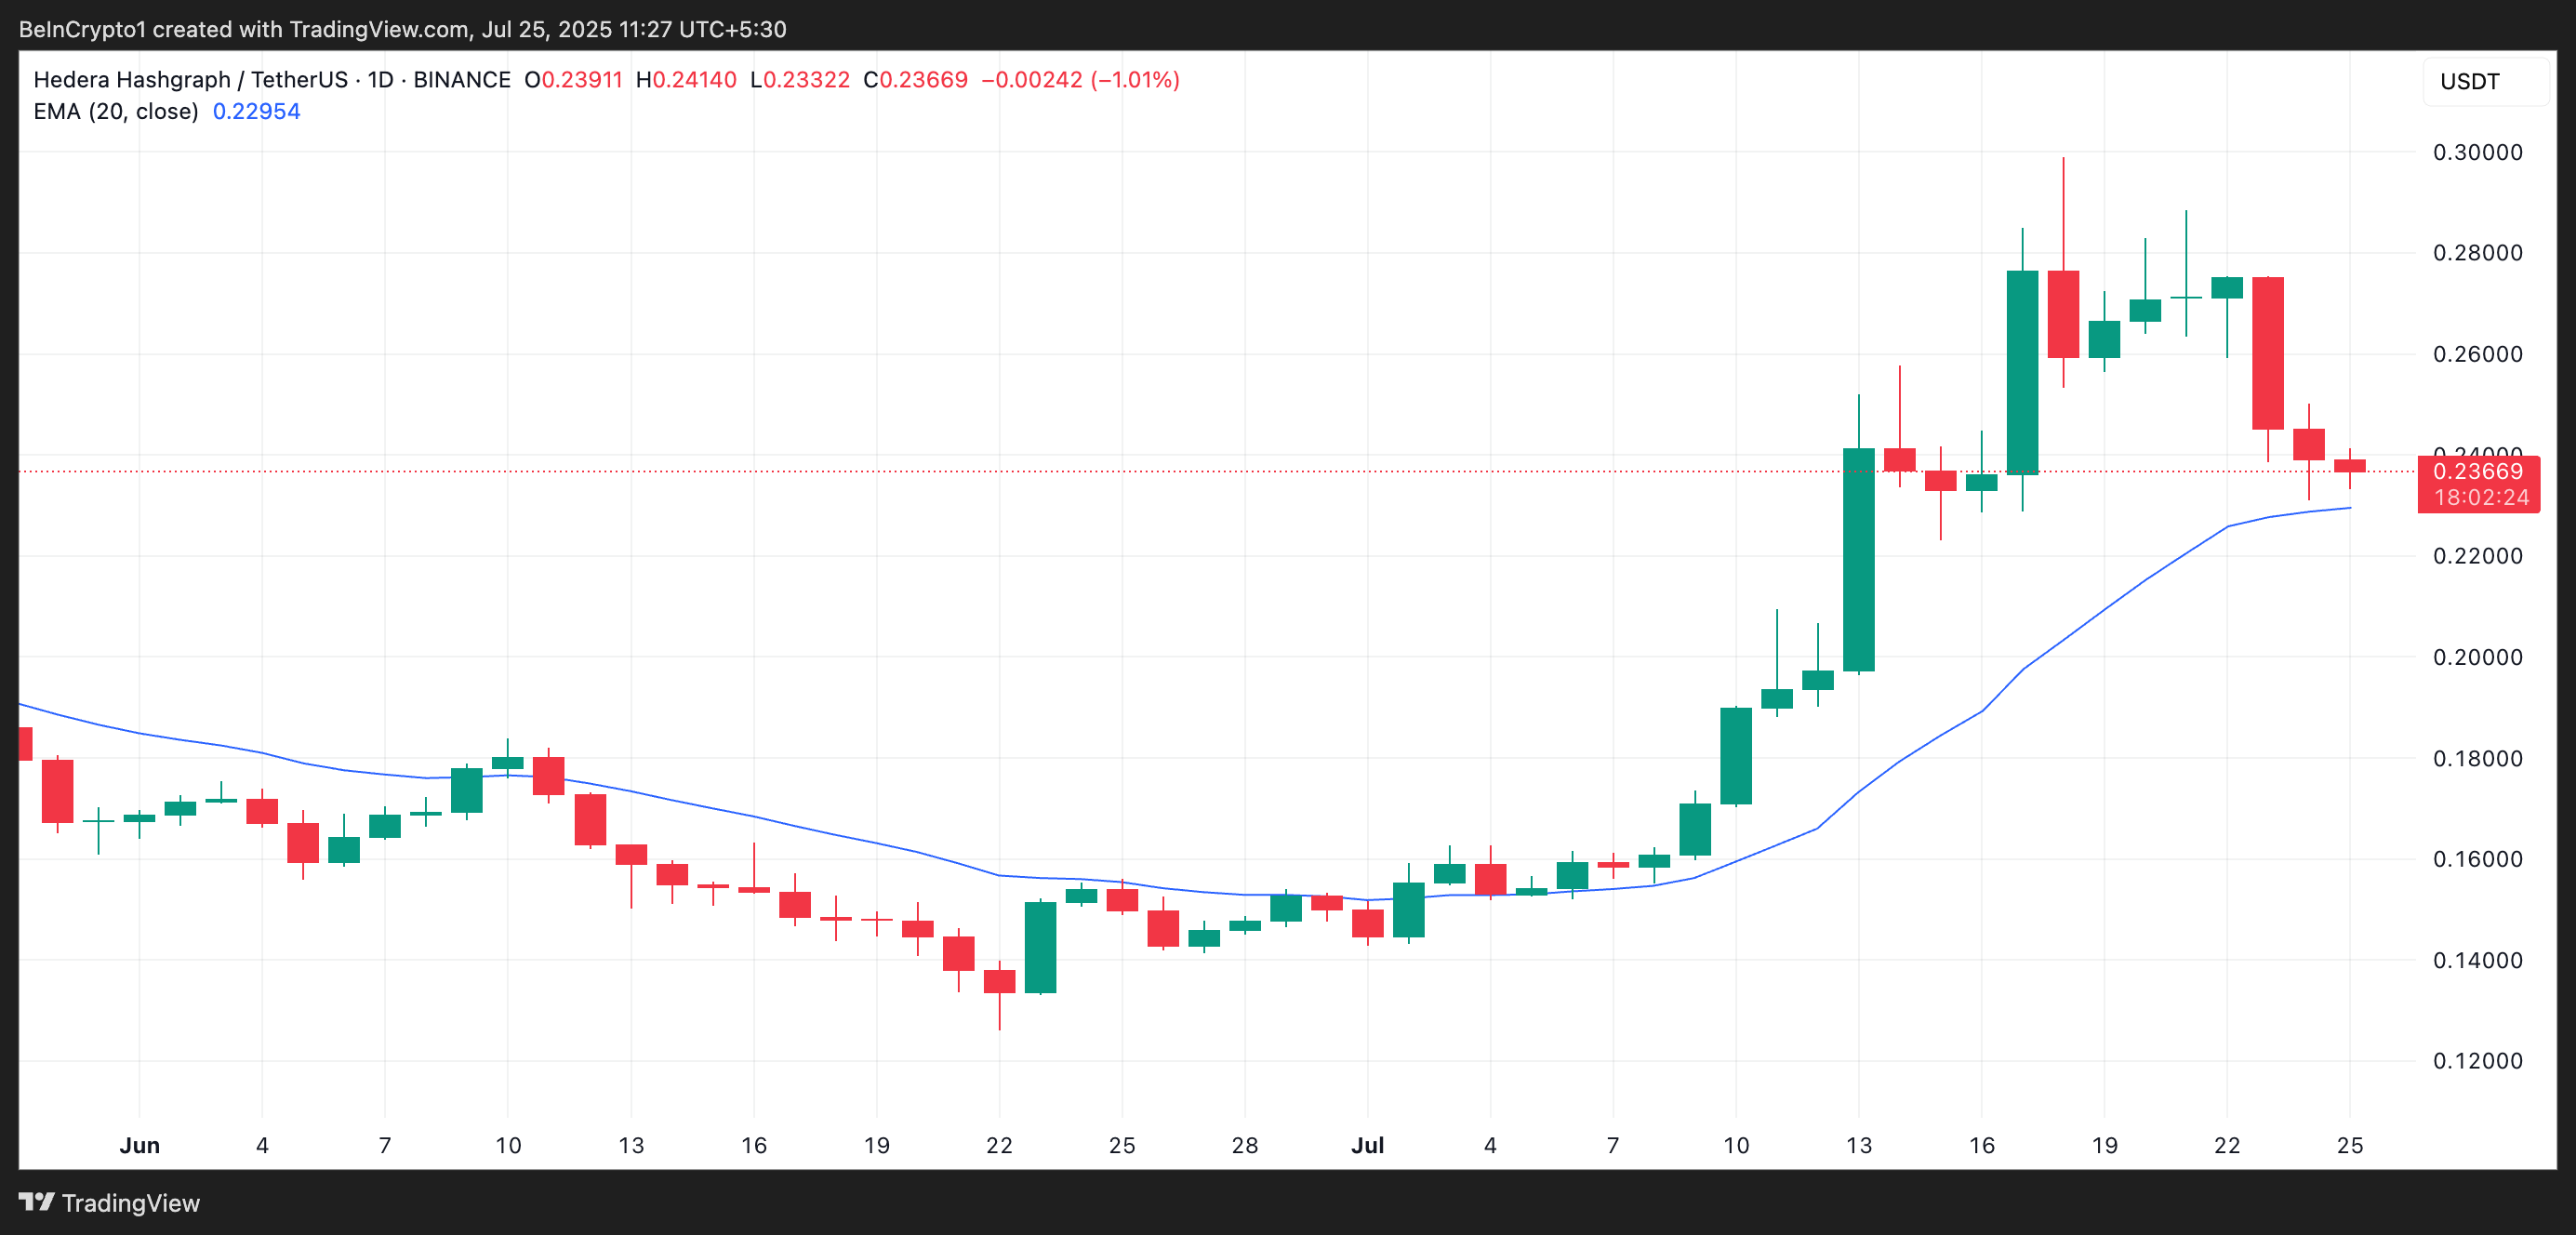
The 20-day EMA measures an asset’s average price over the past 20 trading days, giving weight to recent prices. It is a widely used technical indicator that smooths out recent price action to help identify trends.
When an asset’s price is poised to break below this support level, its short-term momentum is weakening.
If the price falls below this line, especially after an extended uptrend, it signals a potential shift from bullish to bearish sentiment. This setup often triggers further selling as traders interpret it as a loss of short-term support.
HBAR Slides, Yet Bulls Hold the Line
However, not all signals are bearish. Some on-chain data suggests a potential reversal may be underway. First, HBAR’s liquidation heatmap shows a notable liquidity cluster around $0.29, per Coinglass data.
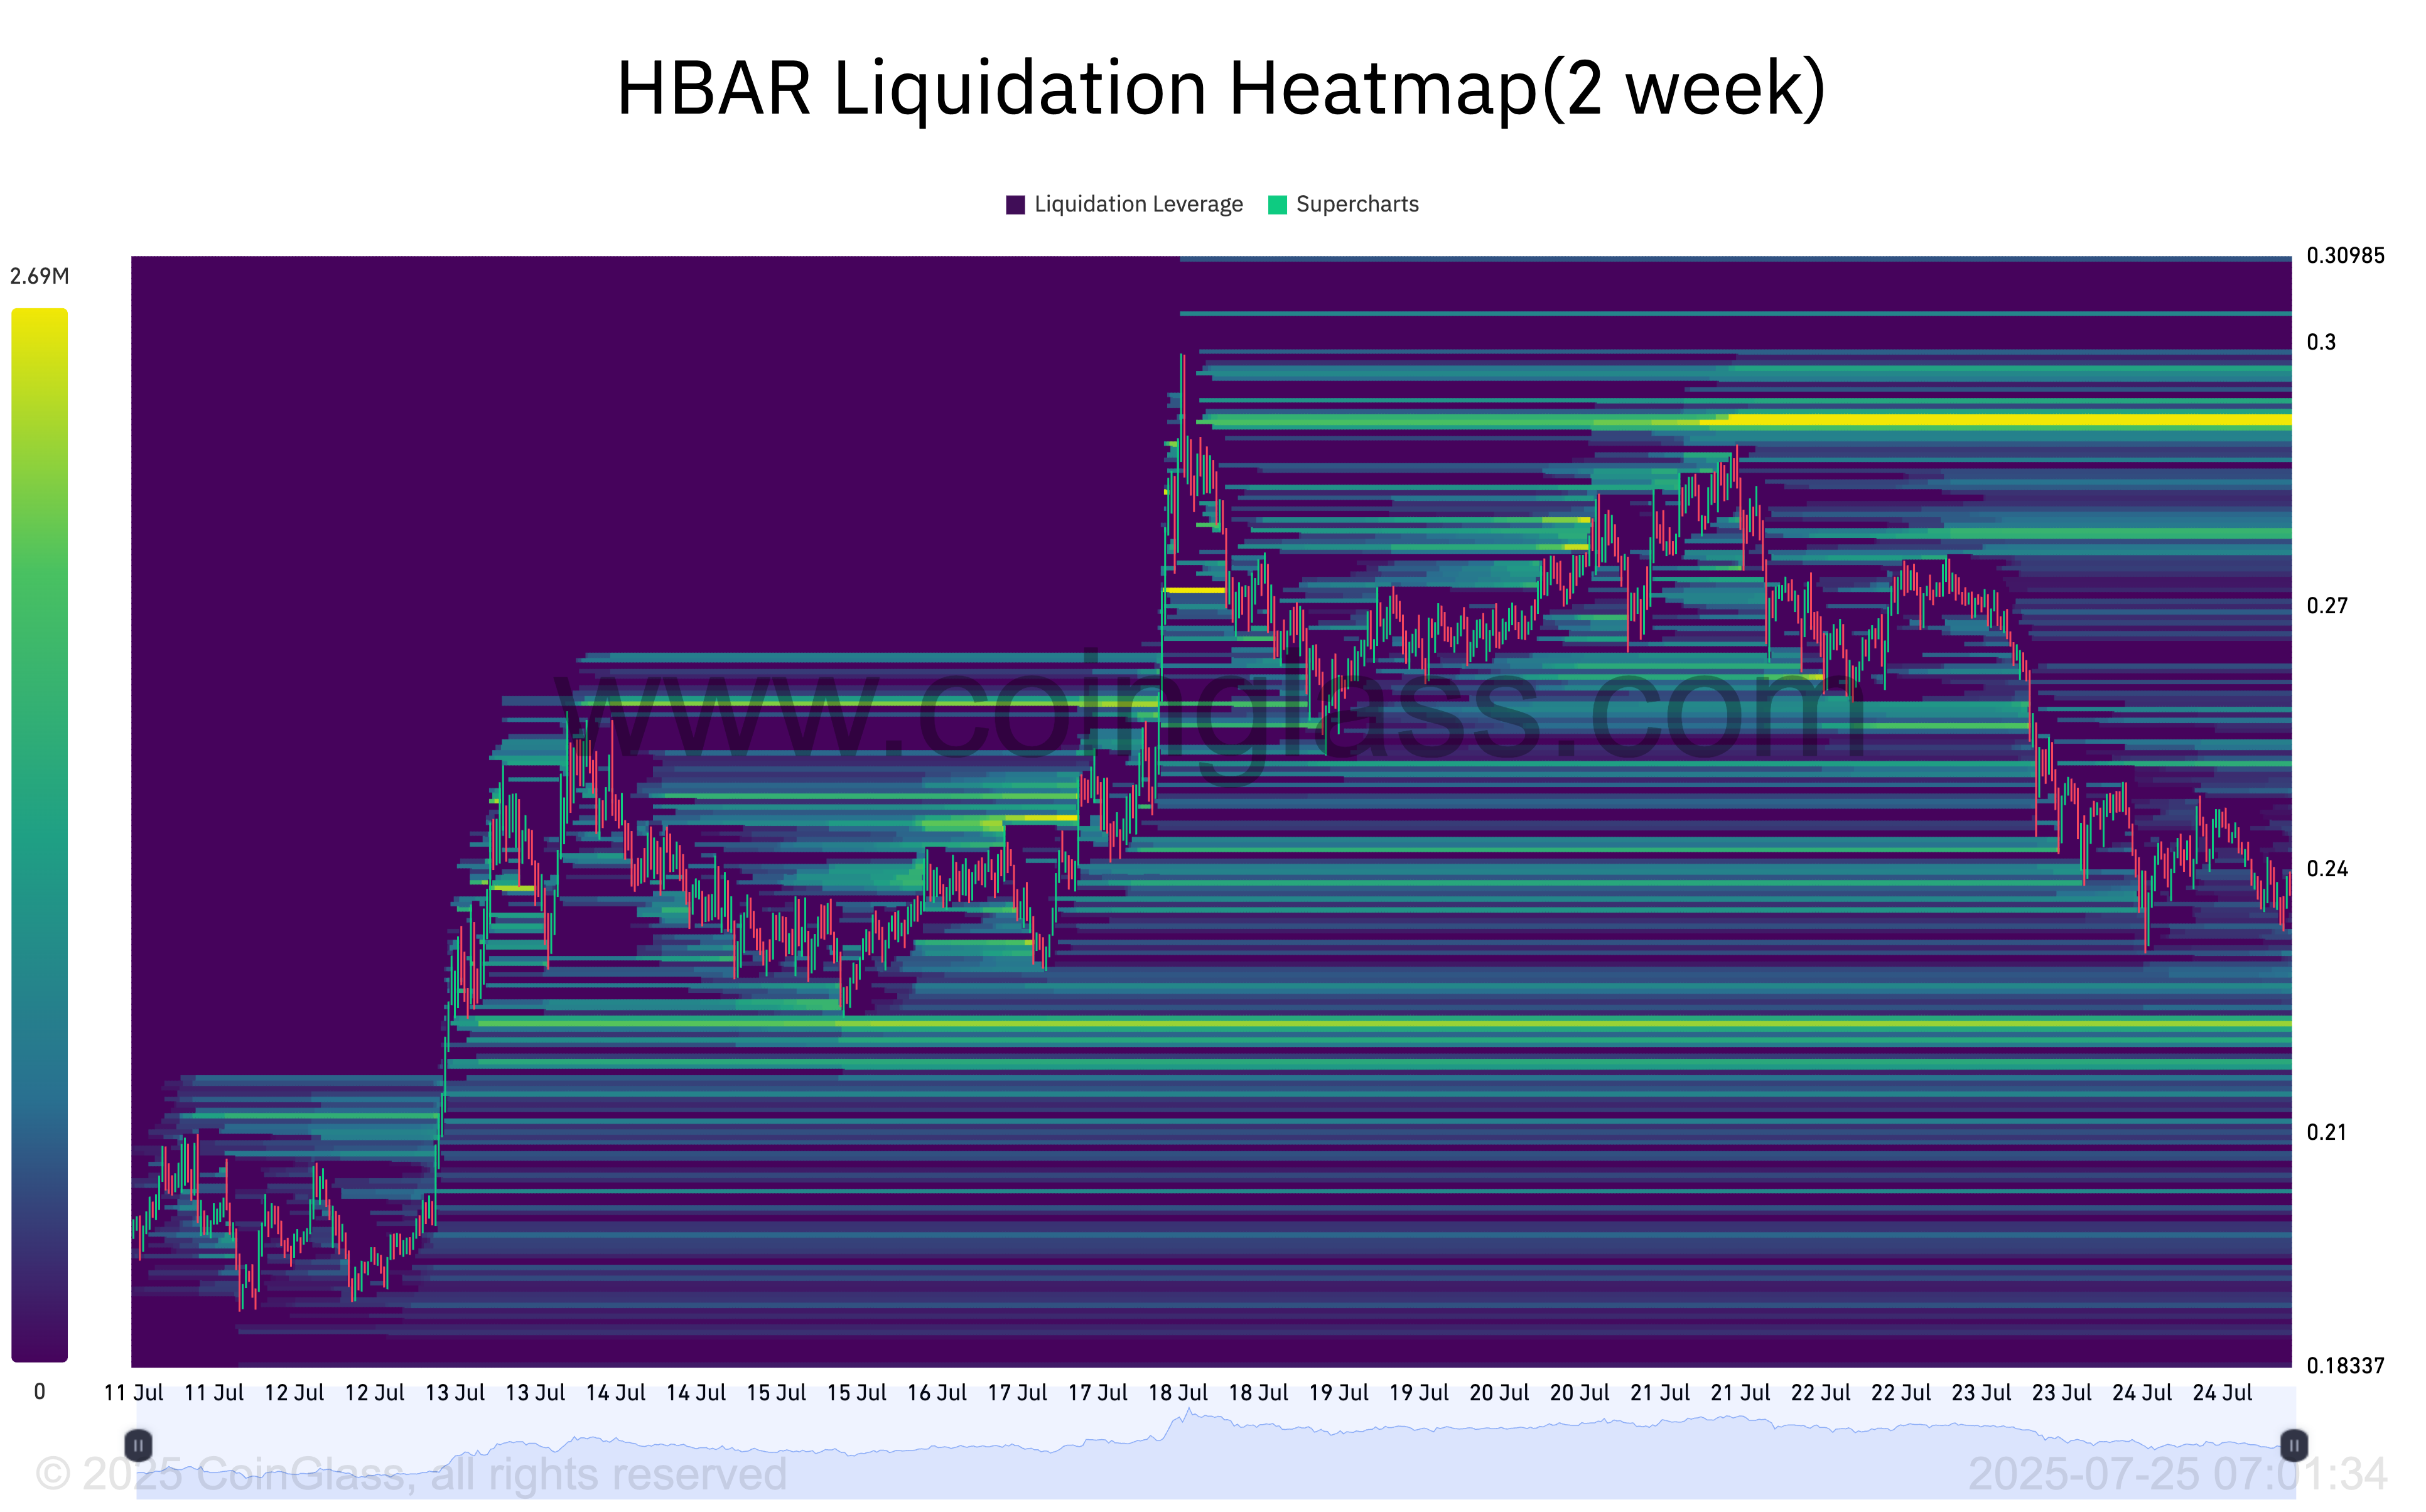
Liquidation heatmaps identify price zones where clusters of Leveraged positions are likely to be liquidated. These maps highlight areas of high liquidity, often color-coded to show intensity, with brighter zones (yellow) representing larger liquidation potential.
When capital clusters FORM above an asset’s current market price, they often attract upward price movement. Traders target these zones to trigger stop-losses or liquidations, creating short-term bullish pressure.
For HBAR, this liquidity cluster around $0.29 could act as a price magnet, drawing the asset higher as the market moves to tap into that pool of orders.
Furthermore, HBAR’s funding rate has remained positive despite its price’s lackluster performance over the past few days. As of this writing, this is at 0.0092%, indicating the preference for long positions among futures market participants.
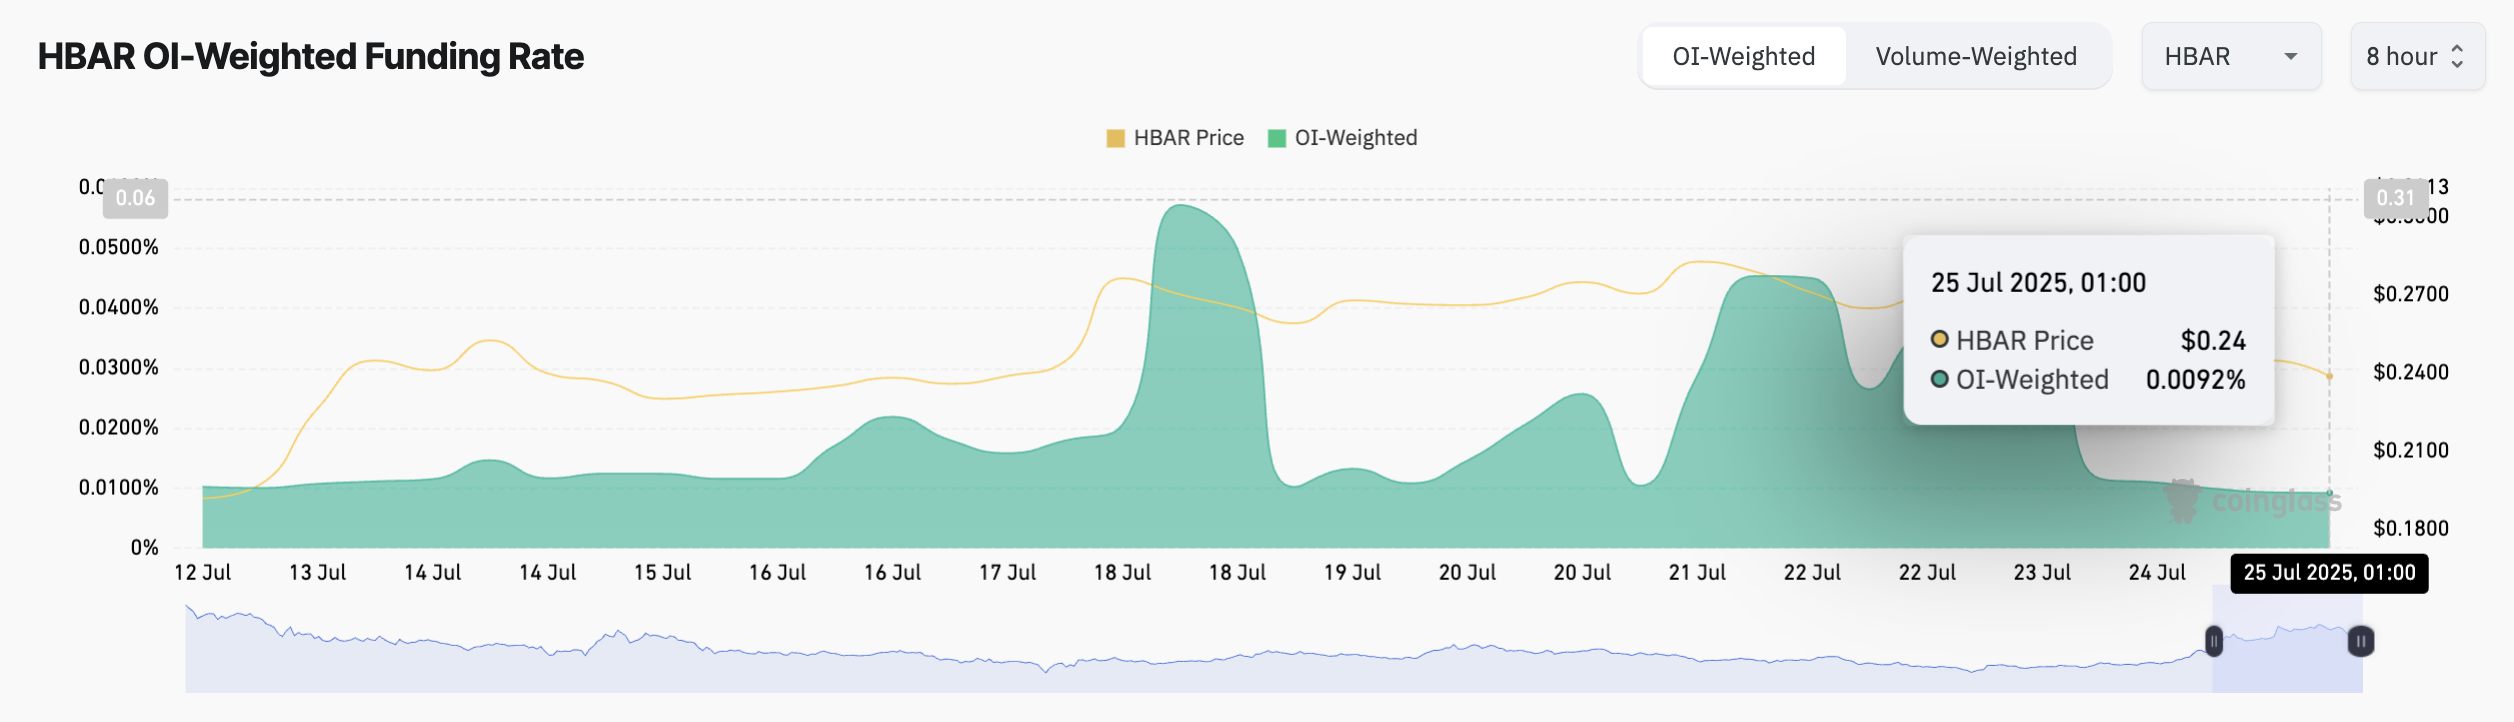
The funding rate is a periodic fee paid between long and short traders in perpetual futures markets to keep the contract price in line with the spot price. When it is positive, more traders are betting on the asset’s price to rise, and longs are paying shorts to maintain their positions.
HBAR’s consistently positive funding rate, even during its recent dip, signals lingering bullish sentiment among traders. It hints at potential upward momentum once market conditions stabilize.
HBAR’s Fate Hangs on 20-Day EMA at $0.22
Improvements in broader market sentiment could strengthen the dynamic support formed by HBAR’s 20-day EMA at $0.22. If this level holds, it may act as a launchpad for a short-term rebound toward the $0.26 mark.
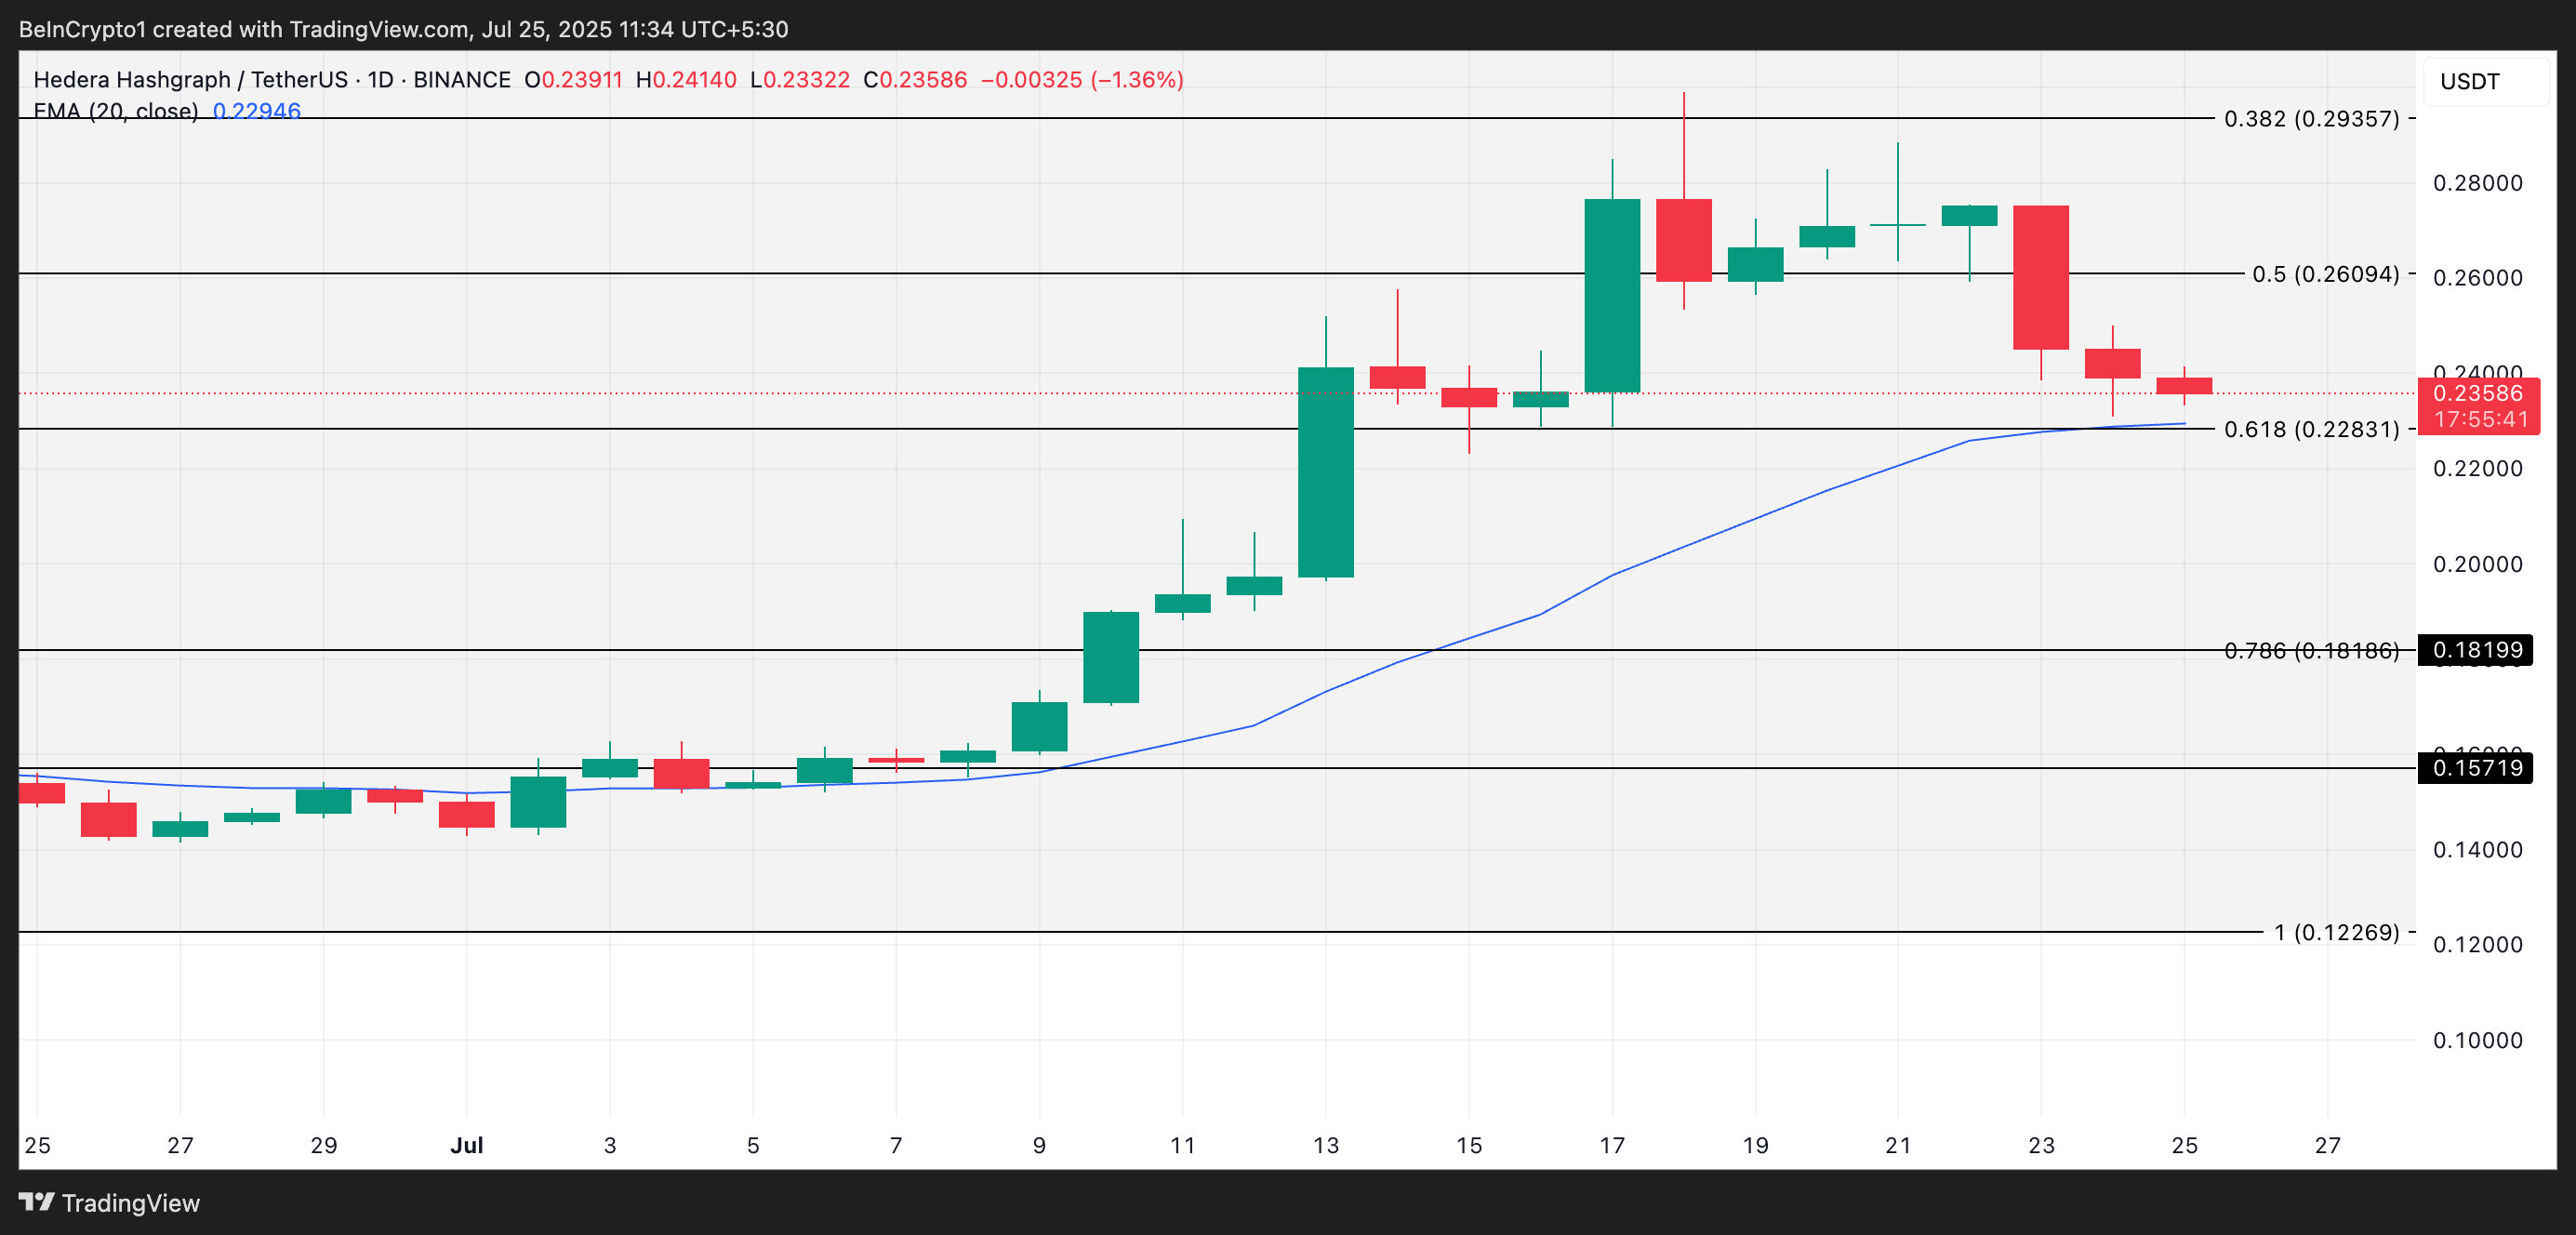
However, a decisive break below this support zone could expose HBAR to further downside, potentially dragging the price as low as $0.18.
