HBAR’s Explosive Rally Hits Final Hurdle – Are Bulls Running Out of Steam?

HBAR's parabolic surge faces a make-or-break moment as resistance tightens. The cryptocurrency's relentless bull run—fueled by enterprise adoption hype and speculative froth—now confronts its toughest test yet.
Can the Hedera-powered asset defy gravity again, or will traders finally take profits like responsible adults (just kidding, this is crypto)?
Technical indicators flash warning signs as volume declines, suggesting fatigue among buyers. Meanwhile, short positions creep upward—a classic hedge fund move that usually precedes either a violent squeeze or a spectacular collapse.
The coming days will reveal whether HBAR's institutional narrative holds weight or if we're witnessing another 'when the music stops' moment in altcoin land. Either way, grab popcorn—volatility's coming.
Bull Power and Netflows Still Favor the Upside
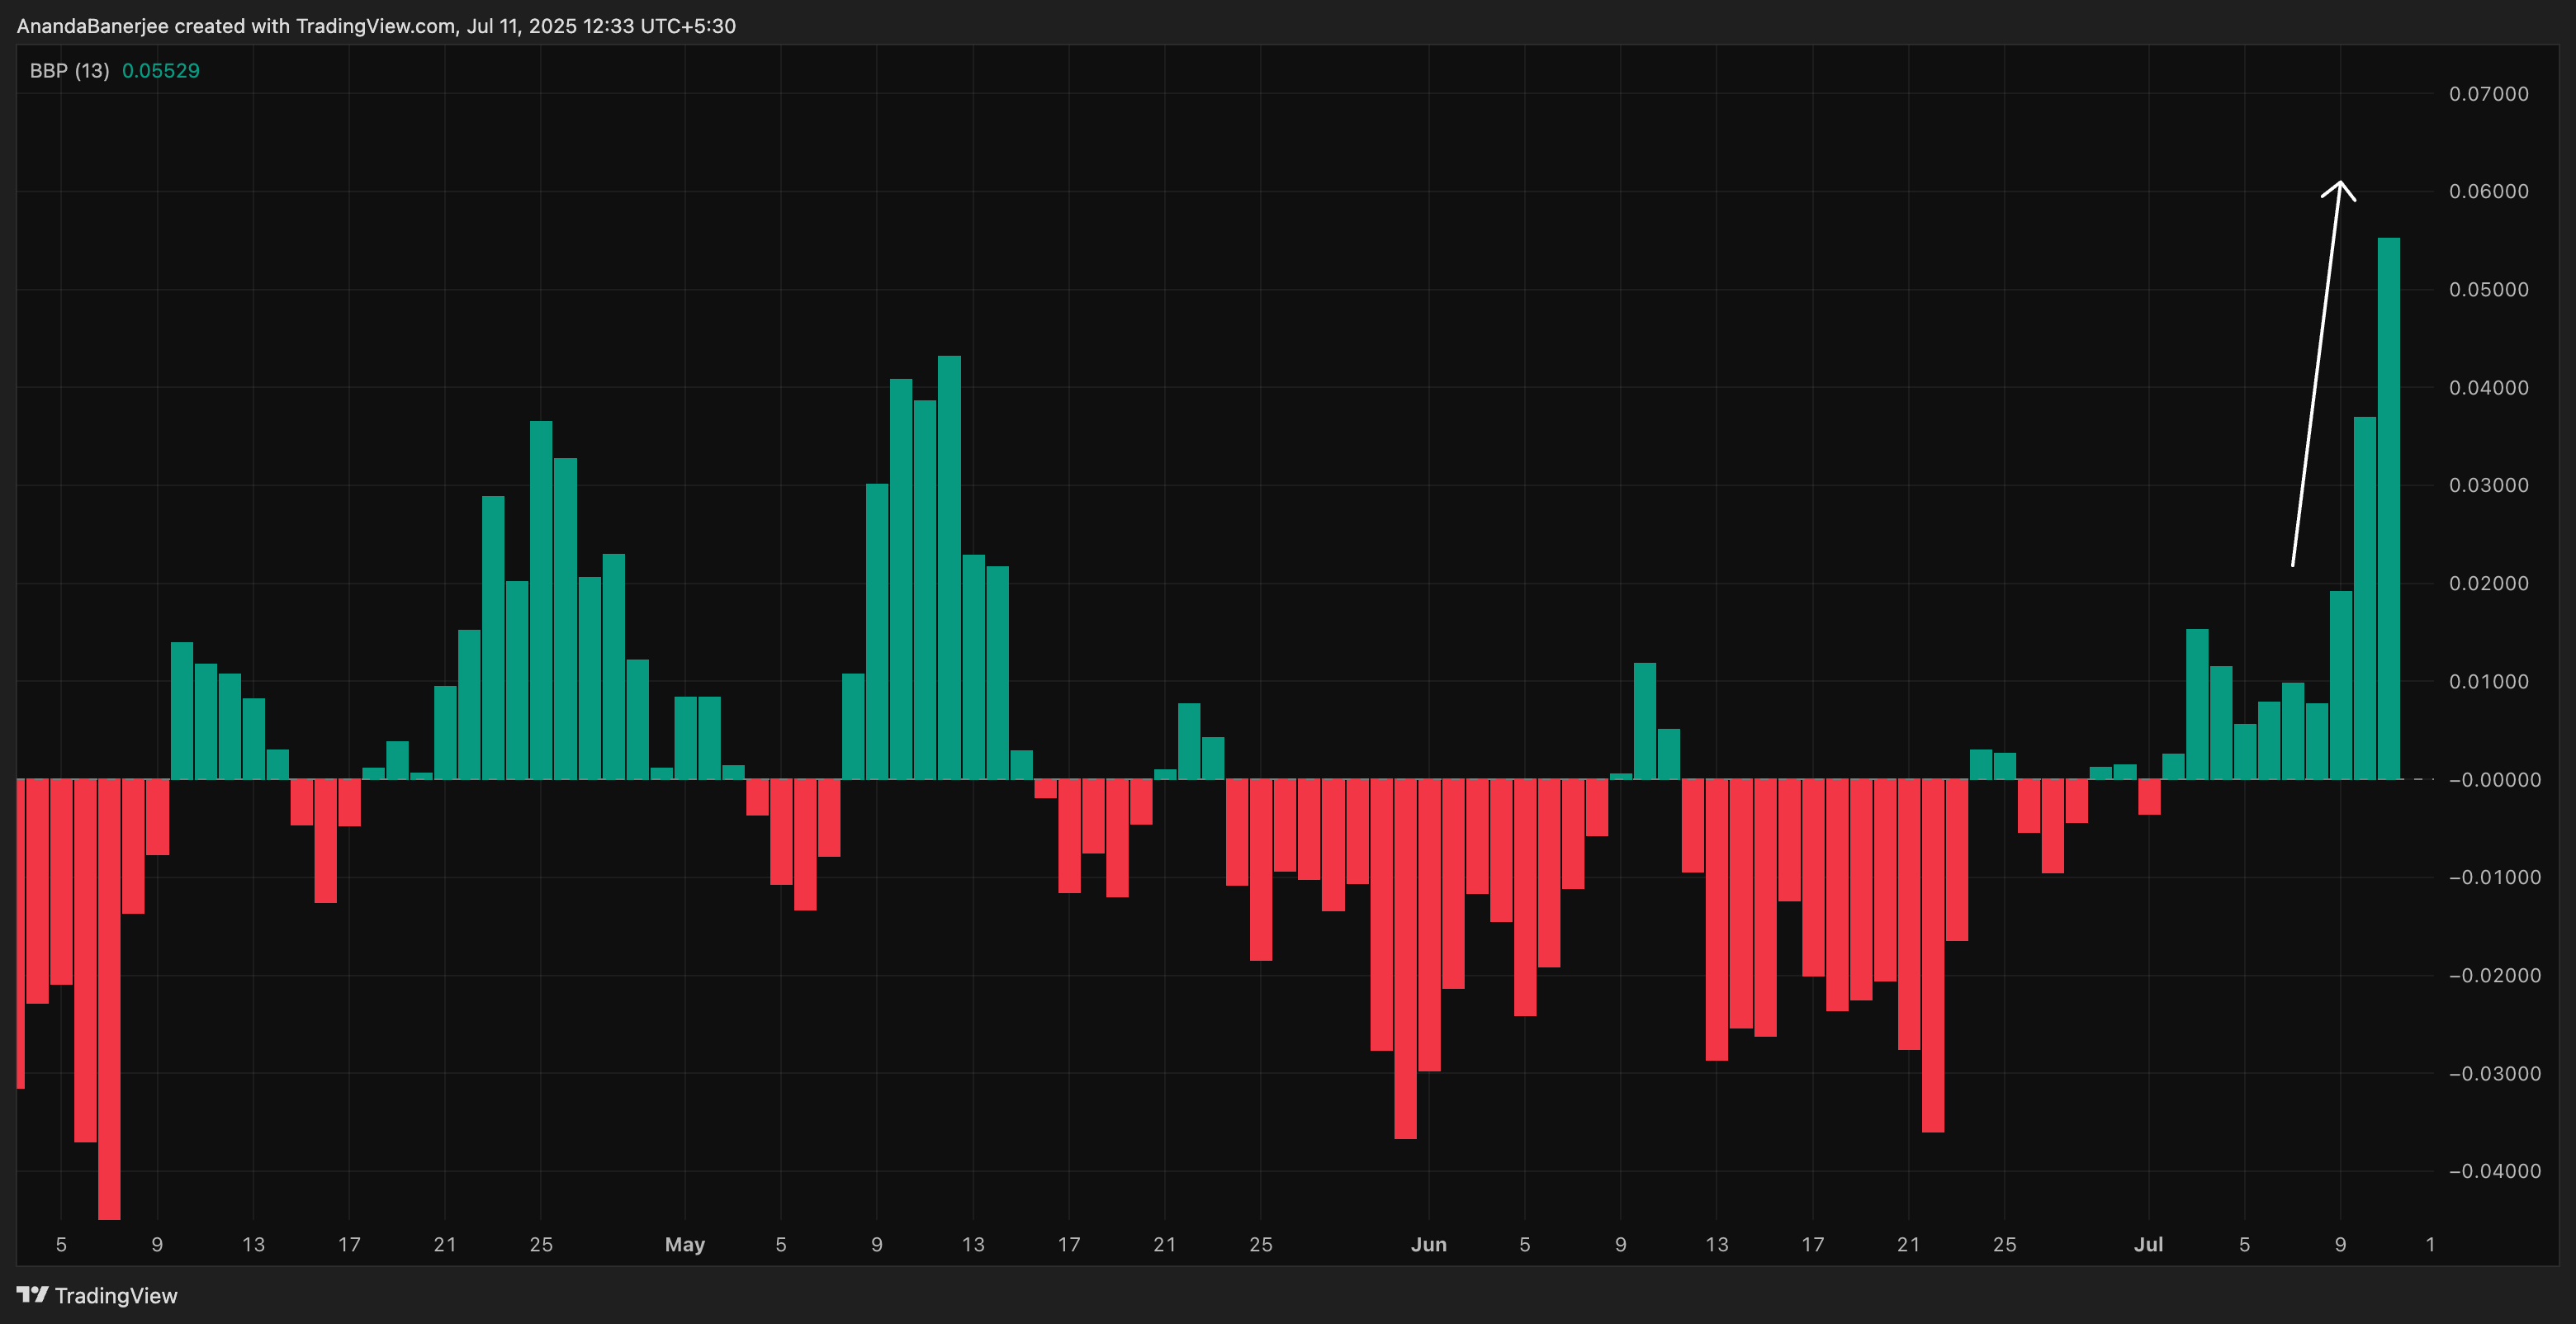
On-chain metrics, however, tell a more nuanced story. The Elder-Ray Bull Power Index, which gauges the strength of buyers over sellers, has ticked up four days in a row. This suggests that despite some visible wicks on recent candles (sellers taking profit), bullish conviction remains in play.
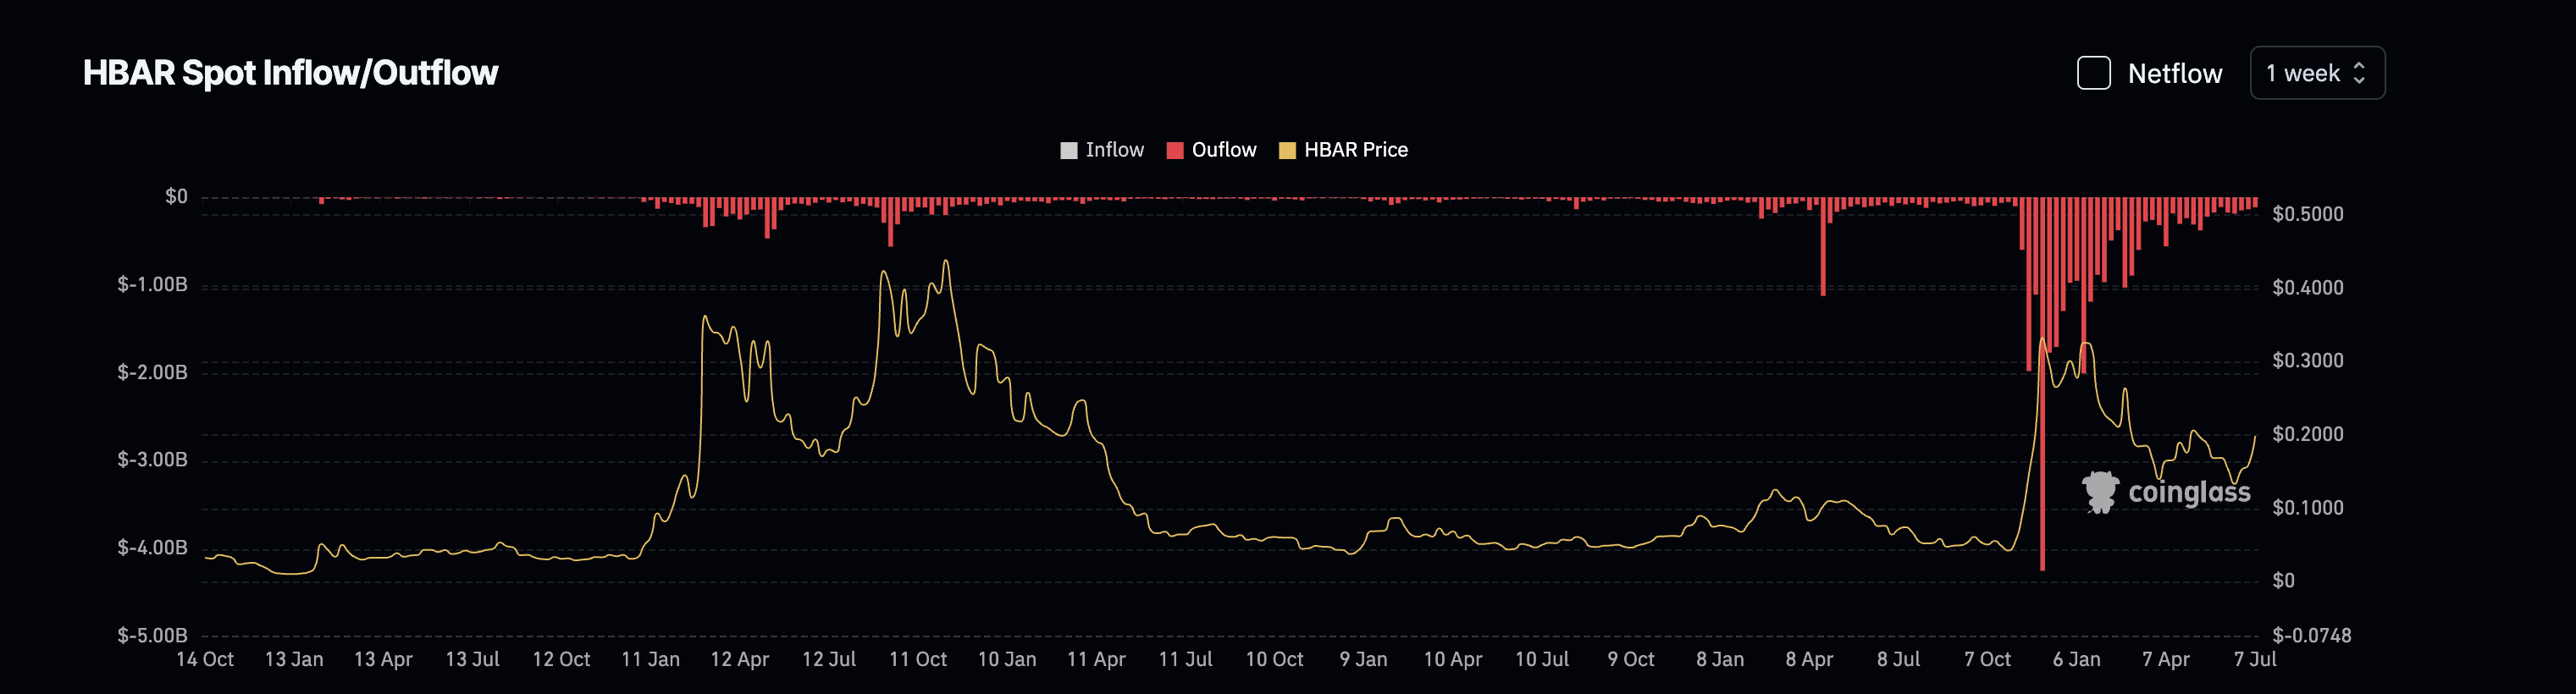
Meanwhile, exchange netflows confirm a cooling off in weekly outflows. While earlier rallies were accompanied by sharp exits from whales and short-term holders, the pace has now moderated, typically a sign that fewer traders are rushing to lock in profits at current levels. It’s not a wave of accumulation, but it does indicate that selling pressure is no longer massive.
Open Interest Signals Market Confidence
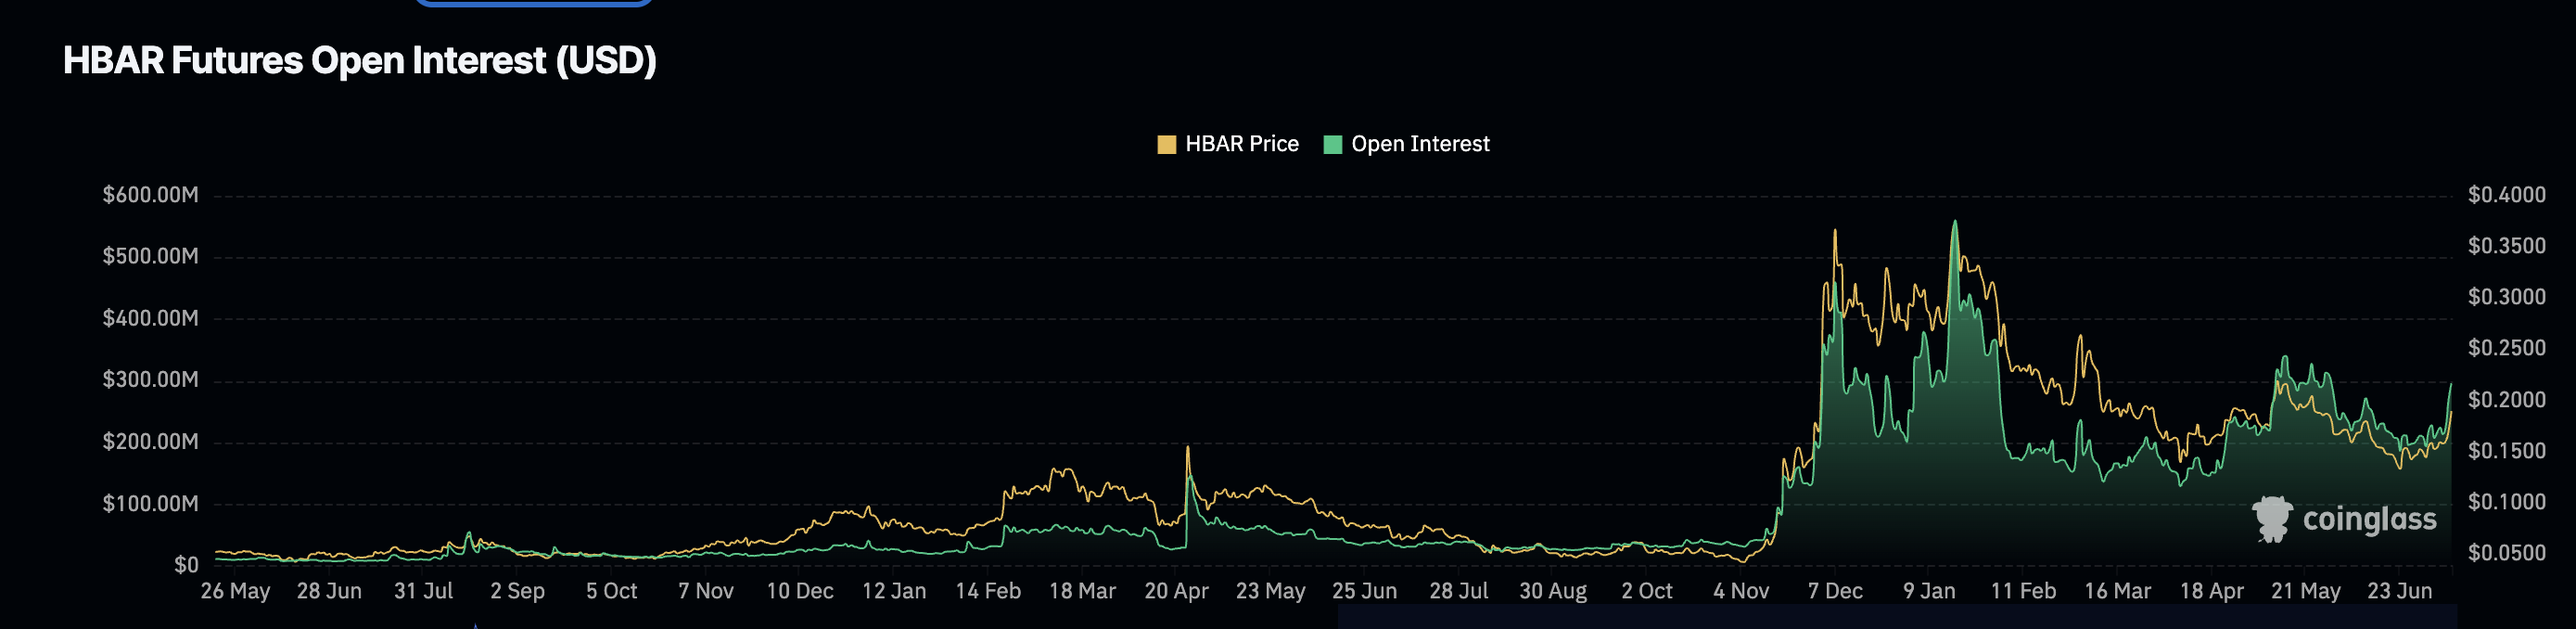
Perhaps the most telling bullish sign comes from Open Interest, which tracks the number of open futures contracts. A sustained rise here typically means new money is entering the market, not exiting. Right now, the OI uptrend suggests traders are still betting on more upside — or at the very least, not ready to fade this MOVE yet.
How’s the HBAR Price Action Looking?
This structural backdrop is reinforced by the standard Fibonacci indicator, with levels drawn from the last $0.12540 swing low to the $0.22867 high. The previous swing levels were used as the latest swing is currently under development. Price is now pressing against the 0.618 level at $0.20430; a level HBAR hasn’t managed to cross recently.
A move above $0.20430 can take HBAR to $0.22867, the previous swing high. HBAR price is currently trading at $0.19914, closer to this key zone.
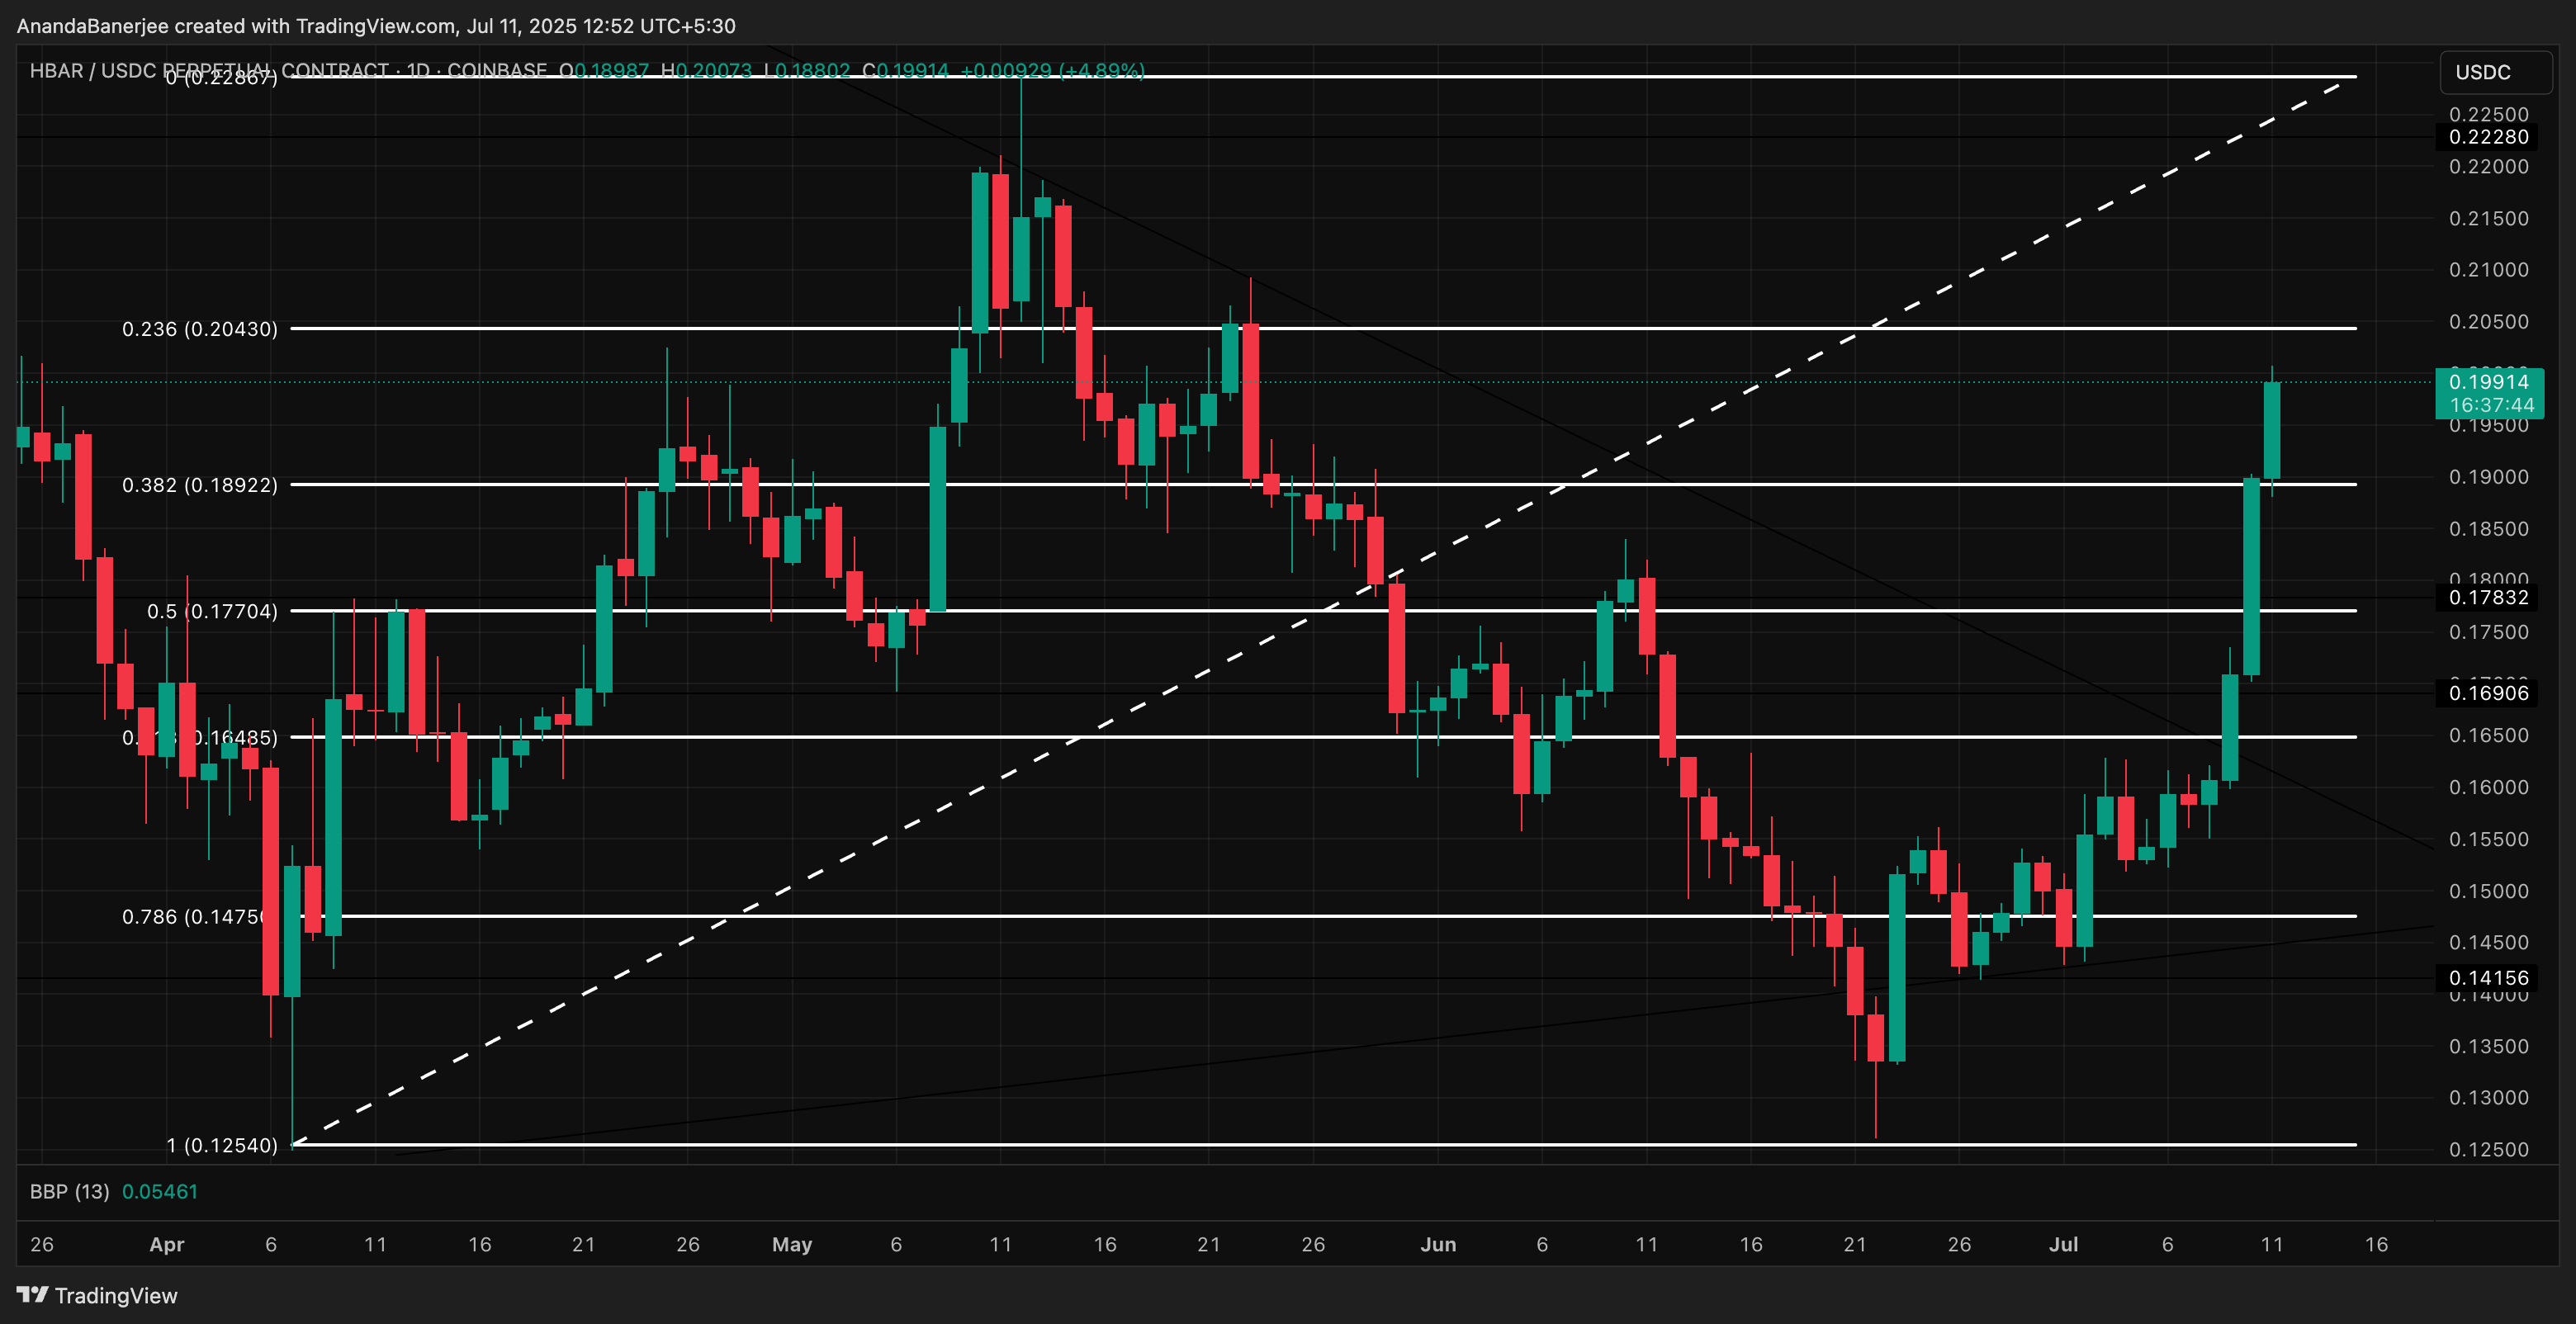
Zooming in, the daily chart shows a mix of momentum and hesitation. The previous two green candles had strong bodies and minimal wicks, classic signs of trend strength. But the latest daily candle reveals a long upper wick (under formation), hinting at rejection and potential exhaustion.
Longer wicks simply mean that bulls are tiring out!
If this candle closes with a longish upper wick, it could mark a short-term local top. If the wick fizzles out, we can expect the trend to continue.
A failure to close convincingly above $0.20430 WOULD validate that exhaustion and likely push HBAR back toward the $0.17704–$0.16485 support zone, invalidating the current bullish trend.
