XRP Traders Double Down as Price Nears Make-or-Break Support Level

XRP bulls dig in as the embattled token tests a critical demand zone—will this be the reversal or just another dead-cat bounce in crypto’s casino economy?
Whales accumulate while retail traders pray. The $0.50 level emerges as a psychological battleground, with derivatives data showing leveraged bets stacking up on both sides. Meanwhile, the SEC’s lawsuit looms like a guillotine over the trading pit.
Cynics note the irony: the same ’institutional adoption’ narrative that fueled XRP’s 2017 mania now gets trotted out whenever bagholders need exit liquidity. But this time—maybe—it’s different?
XRP Gears Up for Potential Rally
According to Coinglass, XRP’s liquidation heatmap shows a notable concentration of liquidity at the $2.48 price zone.
Liquidation heatmaps are visual tools traders use to identify price levels where large clusters of Leveraged positions are likely to be liquidated. These maps highlight areas of high liquidity, often color-coded to show intensity, with brighter zones representing larger liquidation potential.
Usually, these price zones act as magnets for price action, as the market tends to MOVE toward these areas to trigger liquidations and open fresh positions.
Therefore, for XRP, the cluster of liquidity at the $2.48 price level signals strong trader interest in buying or closing short positions at that price. This opens the door for a potential price rally in the NEAR term.

Further, the altcoin’s funding rate has remained positive despite its recent headwinds. Currently, this stands at 0.0041%.
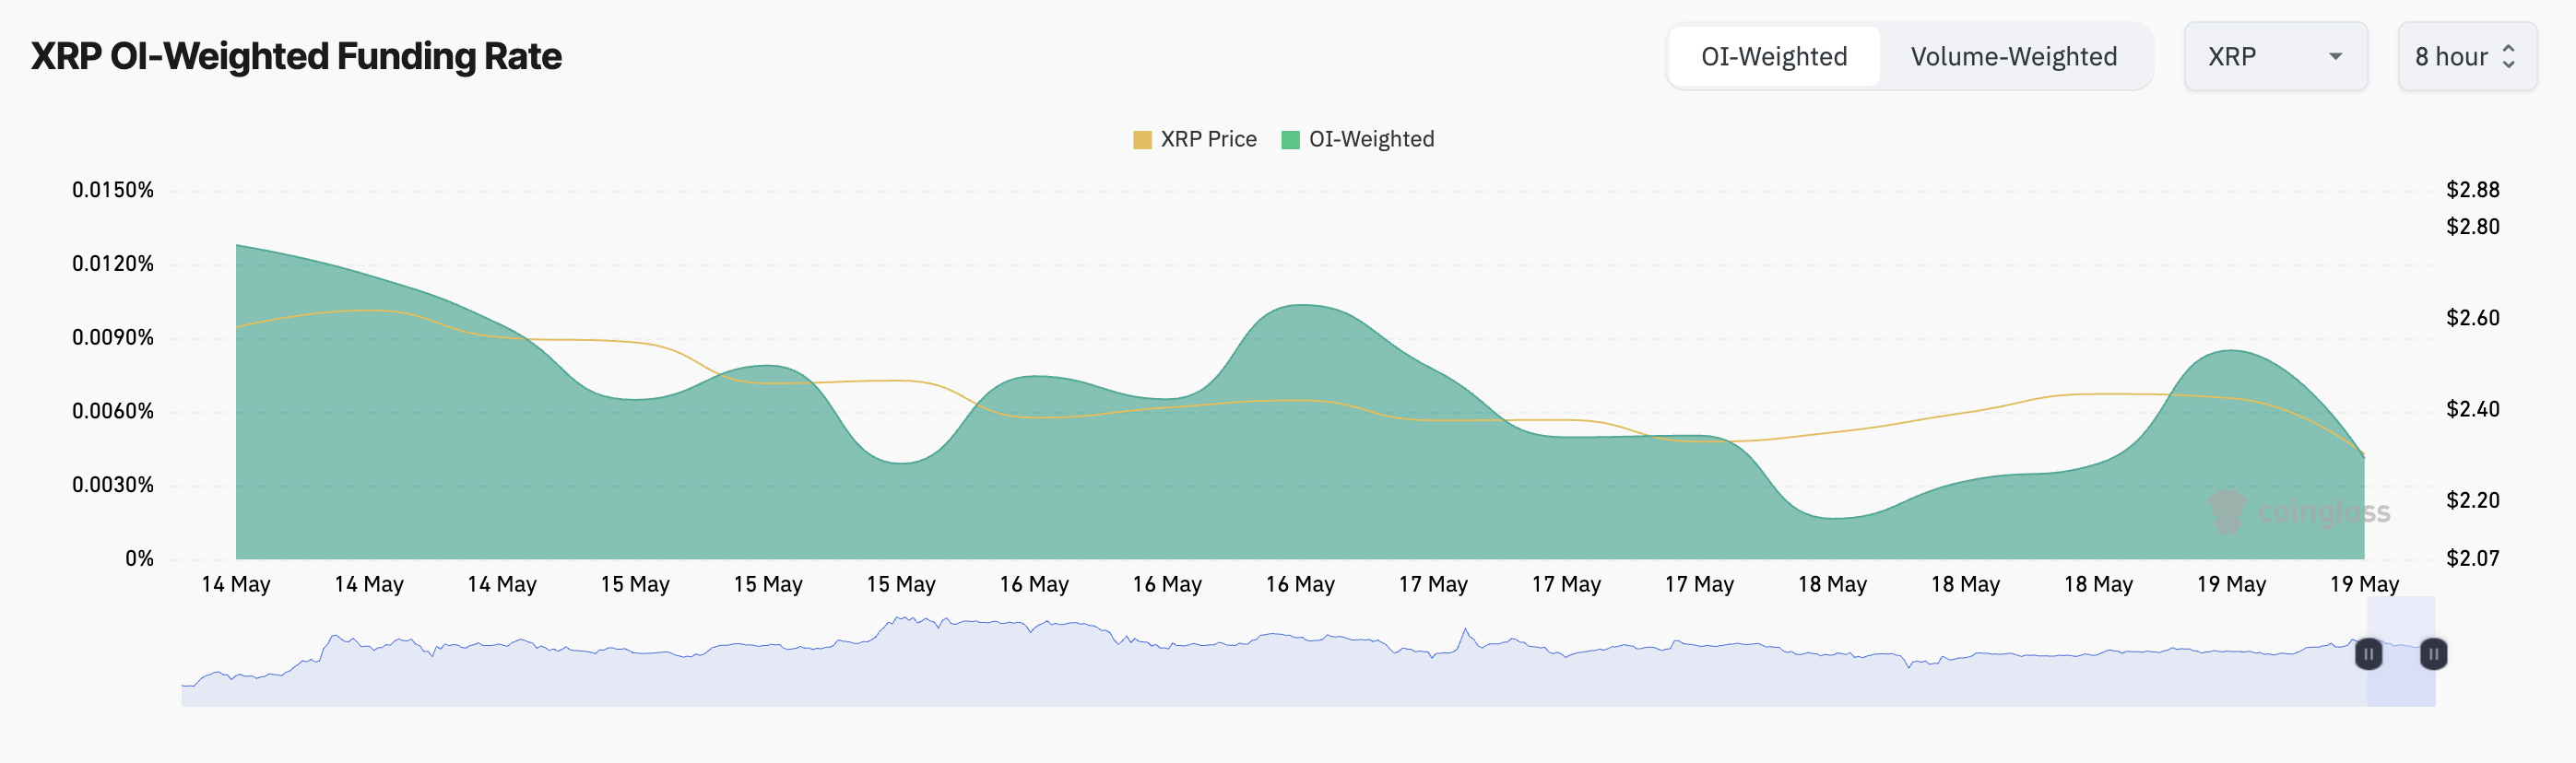
The funding rate is a periodic payment between traders in perpetual futures contracts to keep the contract price aligned with the spot price. When the funding rate is positive, there is a higher demand for long positions. This means that more traders are betting on XRP’s price going up.
XRP Bulls Take Charge
On the daily chart, XRP’s Directional Movement Index (DMI) highlights the growing demand for the altcoin. At press time, the token’s positive directional index (+DI) rests above the negative directional index (-DI).
The DMI indicator measures the strength of an asset’s price trend. It consists of two lines: the +DI, which represents upward price movement, and the -DI, which means downward price movement.
As with XRP, the market trend is bullish when the +DI rests above the -DI. If this persists, the token’s price could surge to $2.50.
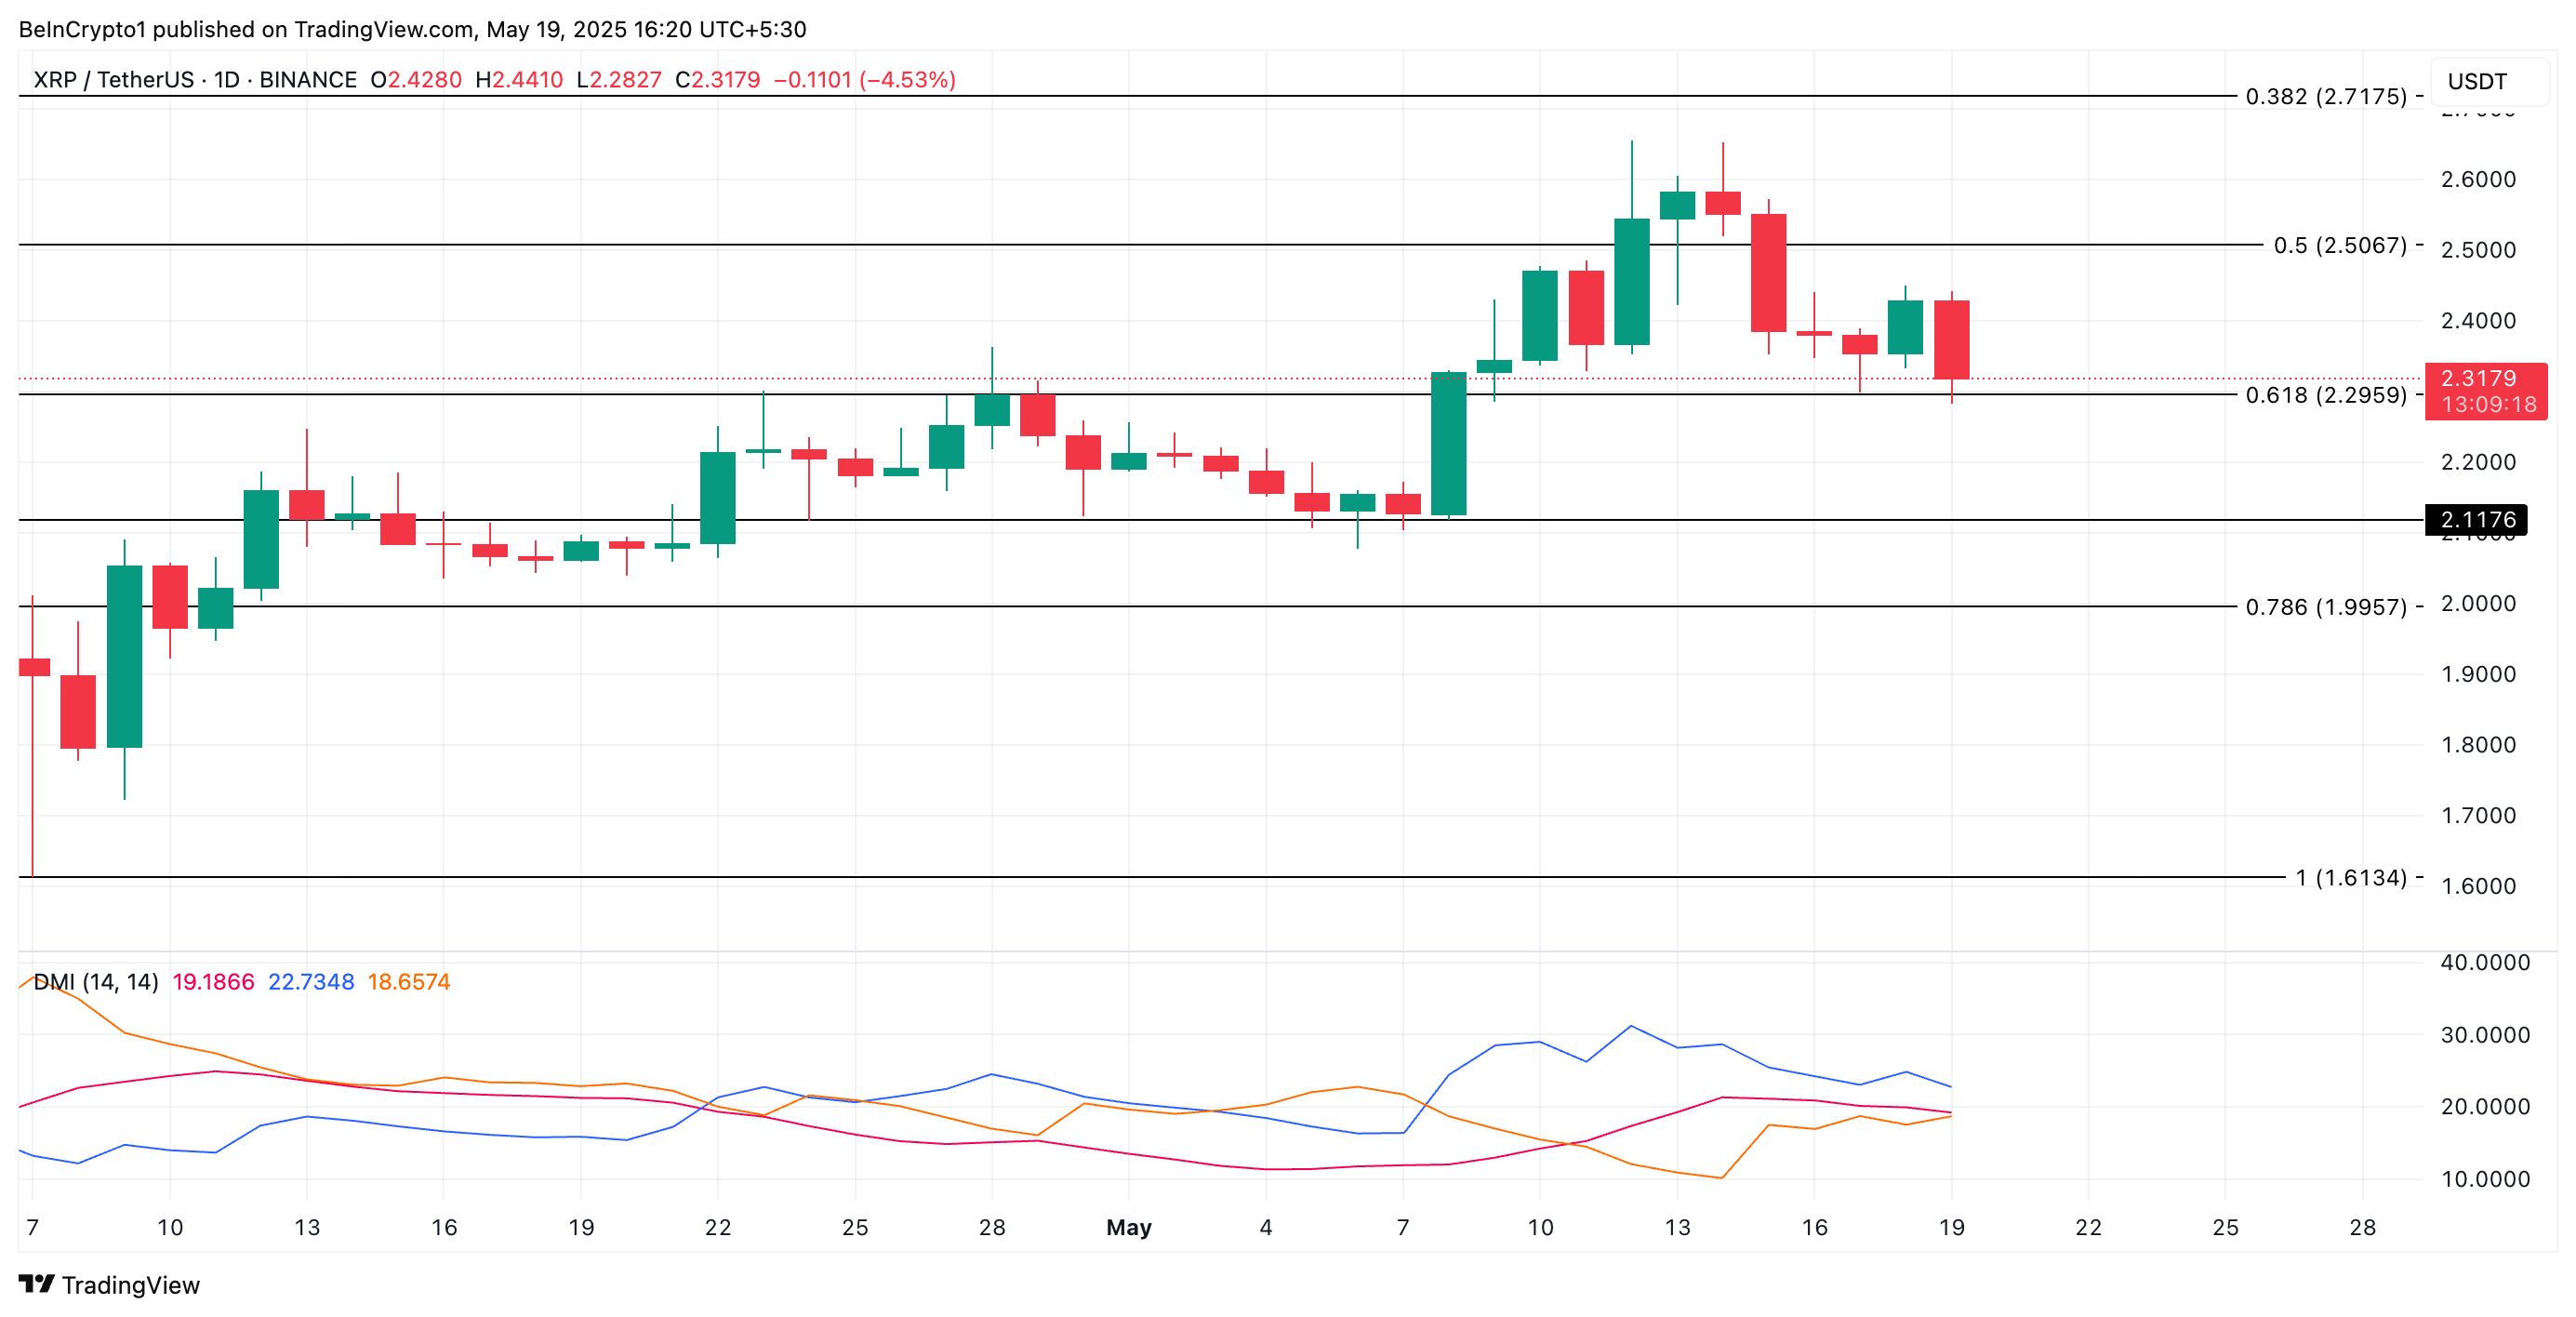
However, if the XRP token price drop continues, its value could fall below $2.29, and trend toward $2.11.
