XRP Surges 8% Amid Sideways Trading – Bulls and Bears Battle at Critical Levels

XRP defies market stagnation with an 8% weekly gain—yet remains trapped between make-or-break price zones. Traders eye breakout potential while skeptics whisper ’dead cat bounce.’
Key levels hold firm as Ripple’s token plays ping-pong with resistance. Volatility lurks beneath the surface, teasing both longs and shorts.
Another day, another crypto asset pretending technical analysis matters more than SEC headlines and whale manipulations. The chartists will still be drawing lines while the insiders cash out.
XRP’s RSI Rebounds: What It Means for the Price Action
XRP’s Relative Strength Index (RSI) currently stands at 58.36, rising from 47.34 earlier today but still down from 77.7 reached four days ago.
This movement shows a recovery from recent lower levels, although it remains below the overbought conditions seen earlier in the week.
The recent RSI trend suggests that while bullish momentum has resurfaced in the short term, XRP has not yet regained the same strength it displayed just a few days ago, signaling a more cautious sentiment among traders.

RSI, or Relative Strength Index, is a momentum oscillator that measures the speed and change of price movements on a scale from 0 to 100.
Typically, an RSI above 70 signals that an asset is overbought and might be due for a correction, while an RSI below 30 indicates it is oversold and could be poised for a rebound.
With XRP’s RSI now at 58.36, the asset is in neutral-to-slightly-bullish territory, suggesting there is still room for further gains without immediately triggering overbought conditions.
If buying pressure continues, this could set the stage for a gradual upward move, though a lack of strong momentum could also result in range-bound trading.
XRP Hovers Above Cloud as Momentum Stalls
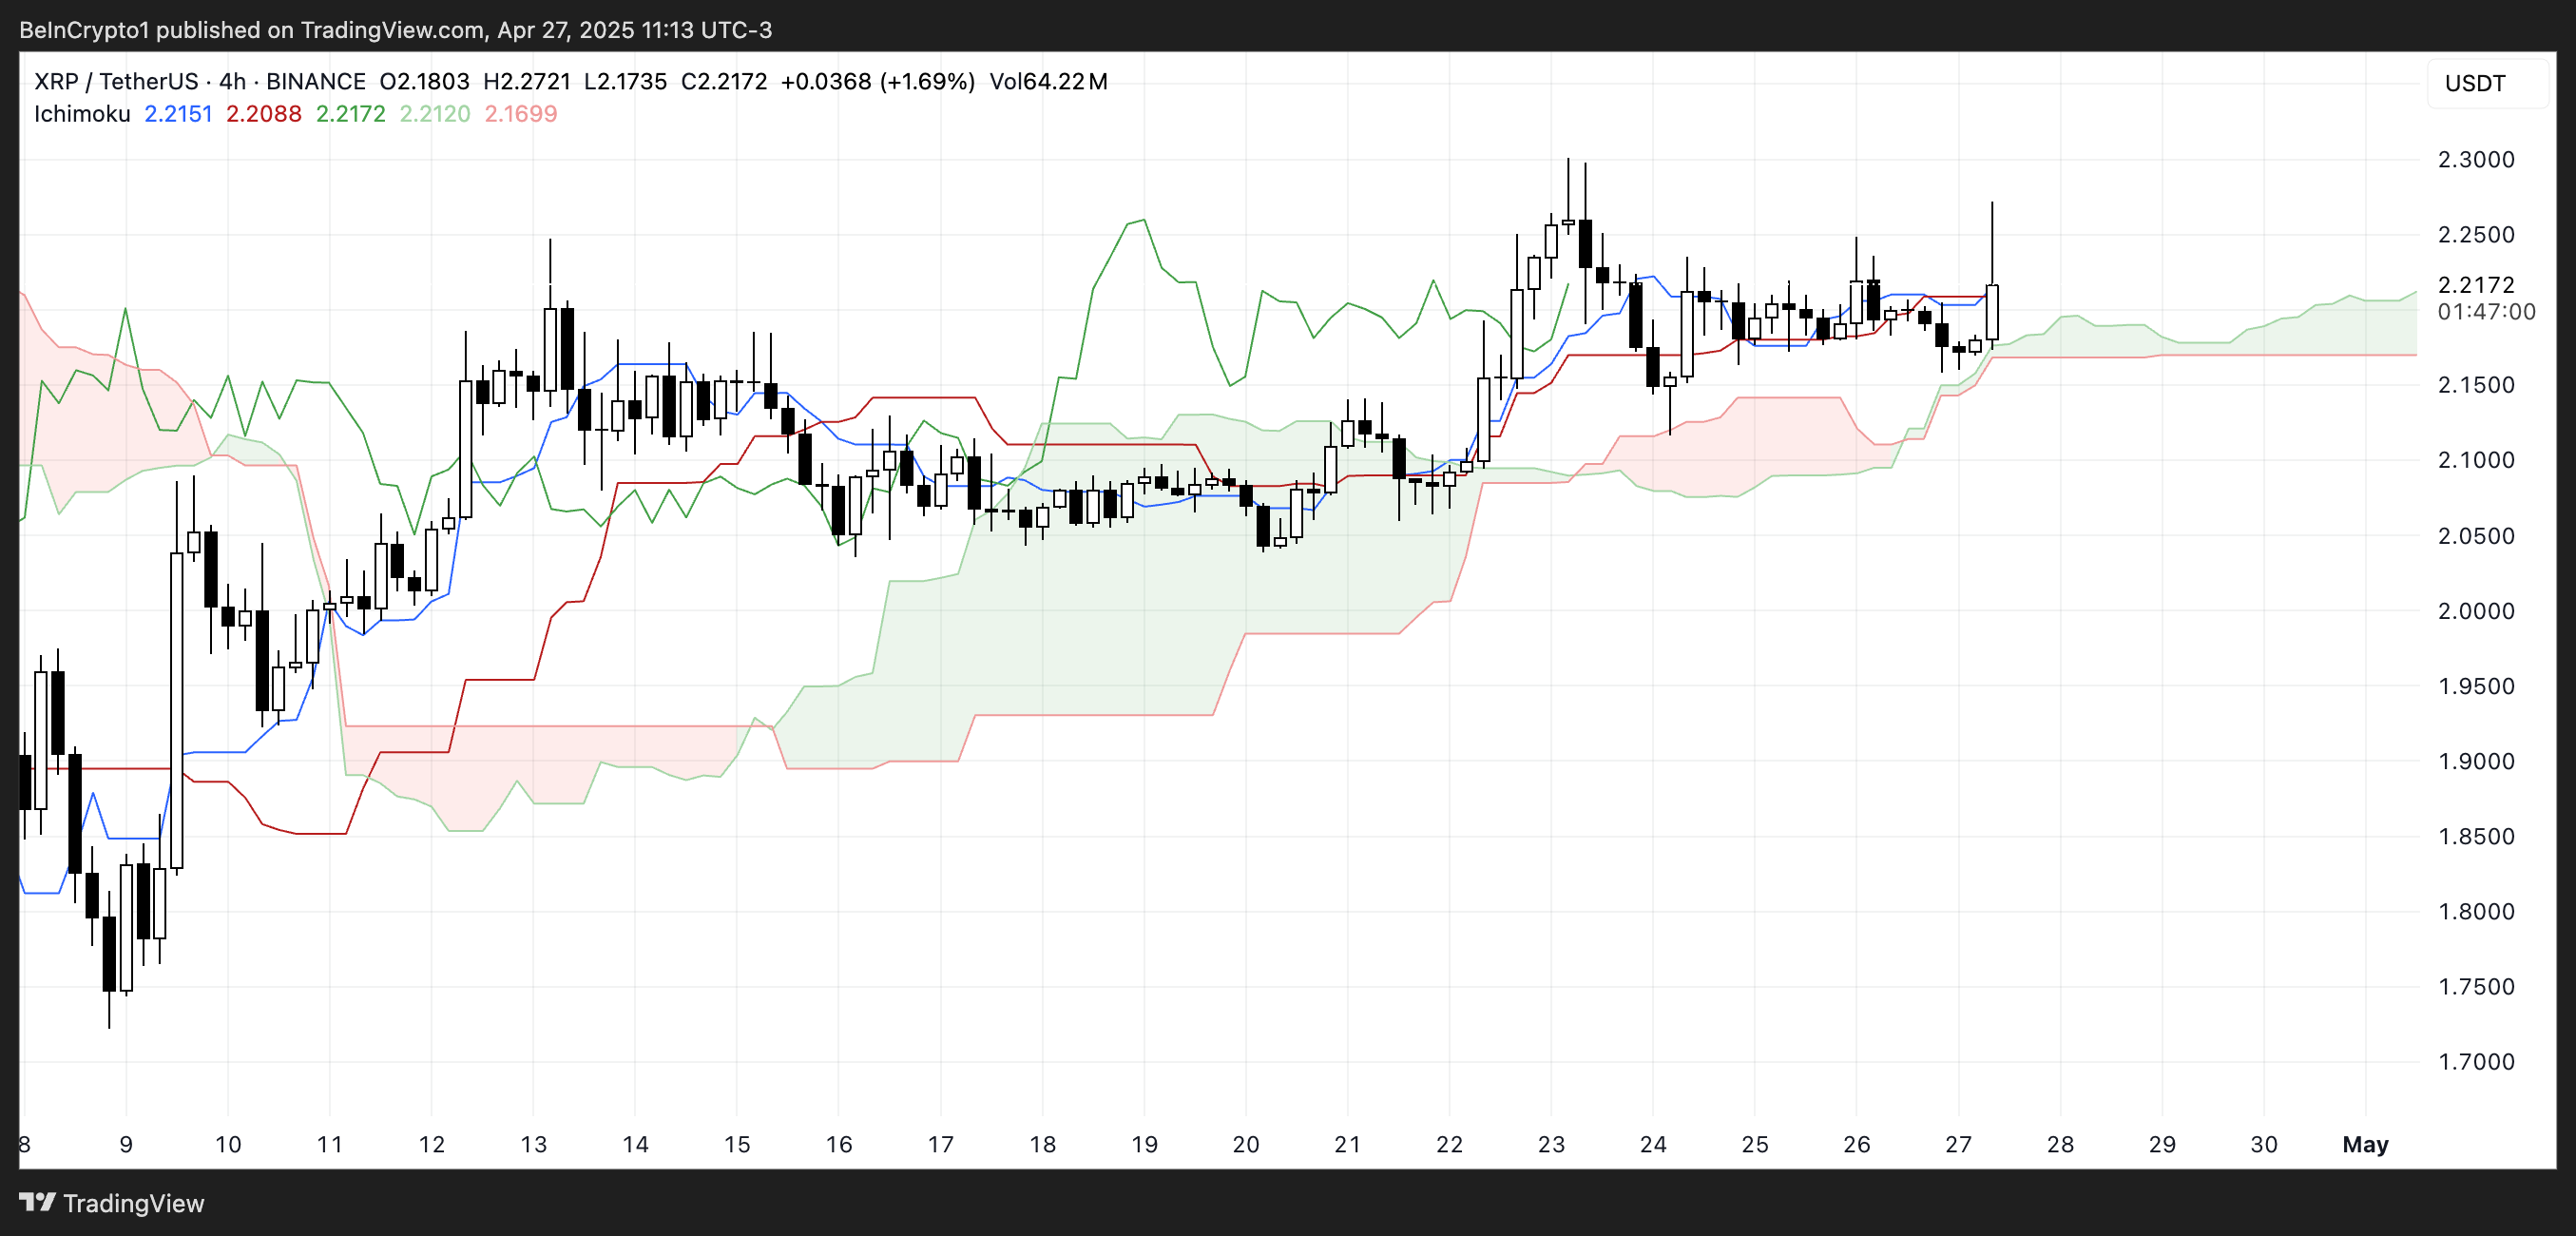
The Ichimoku Cloud for XRP presents a bullish structure, with the price just slightly above the cloud.
The blue (Tenkan-sen) and red (Kijun-sen) lines are close to the current candle, reflecting a market with a slight bullish bias but without strong momentum.
The future cloud remains green, indicating that bullish conditions are still projected ahead. However, the proximity of the lines to the price suggests some hesitation or consolidation in the short term.
The Ichimoku system fully views trend direction, momentum, and support/resistance areas.
When the price is above the cloud with a green cloud ahead, it usually signals a favorable trend, but when the Tenkan-sen and Kijun-sen hug the price closely, it can indicate a lack of clear conviction from either buyers or sellers.
In XRP’s case, the bullish trend remains intact, but the tight positioning of the lines points to a fragile uptrend where a sharp move in either direction could easily shift the structure.
XRP Outlook: Will Bulls or Bears Take Control?
XRP price is trading within a tight range, caught between a resistance level of $2.30 and a support level of $2.11.
This sideways movement comes just two days after the launch of the world’s first XRP ETF in Brazil, a development that could eventually influence market sentiment.
If XRP falls and loses the $2.11 support, it could lead to a decline toward the next support level, $2.04.
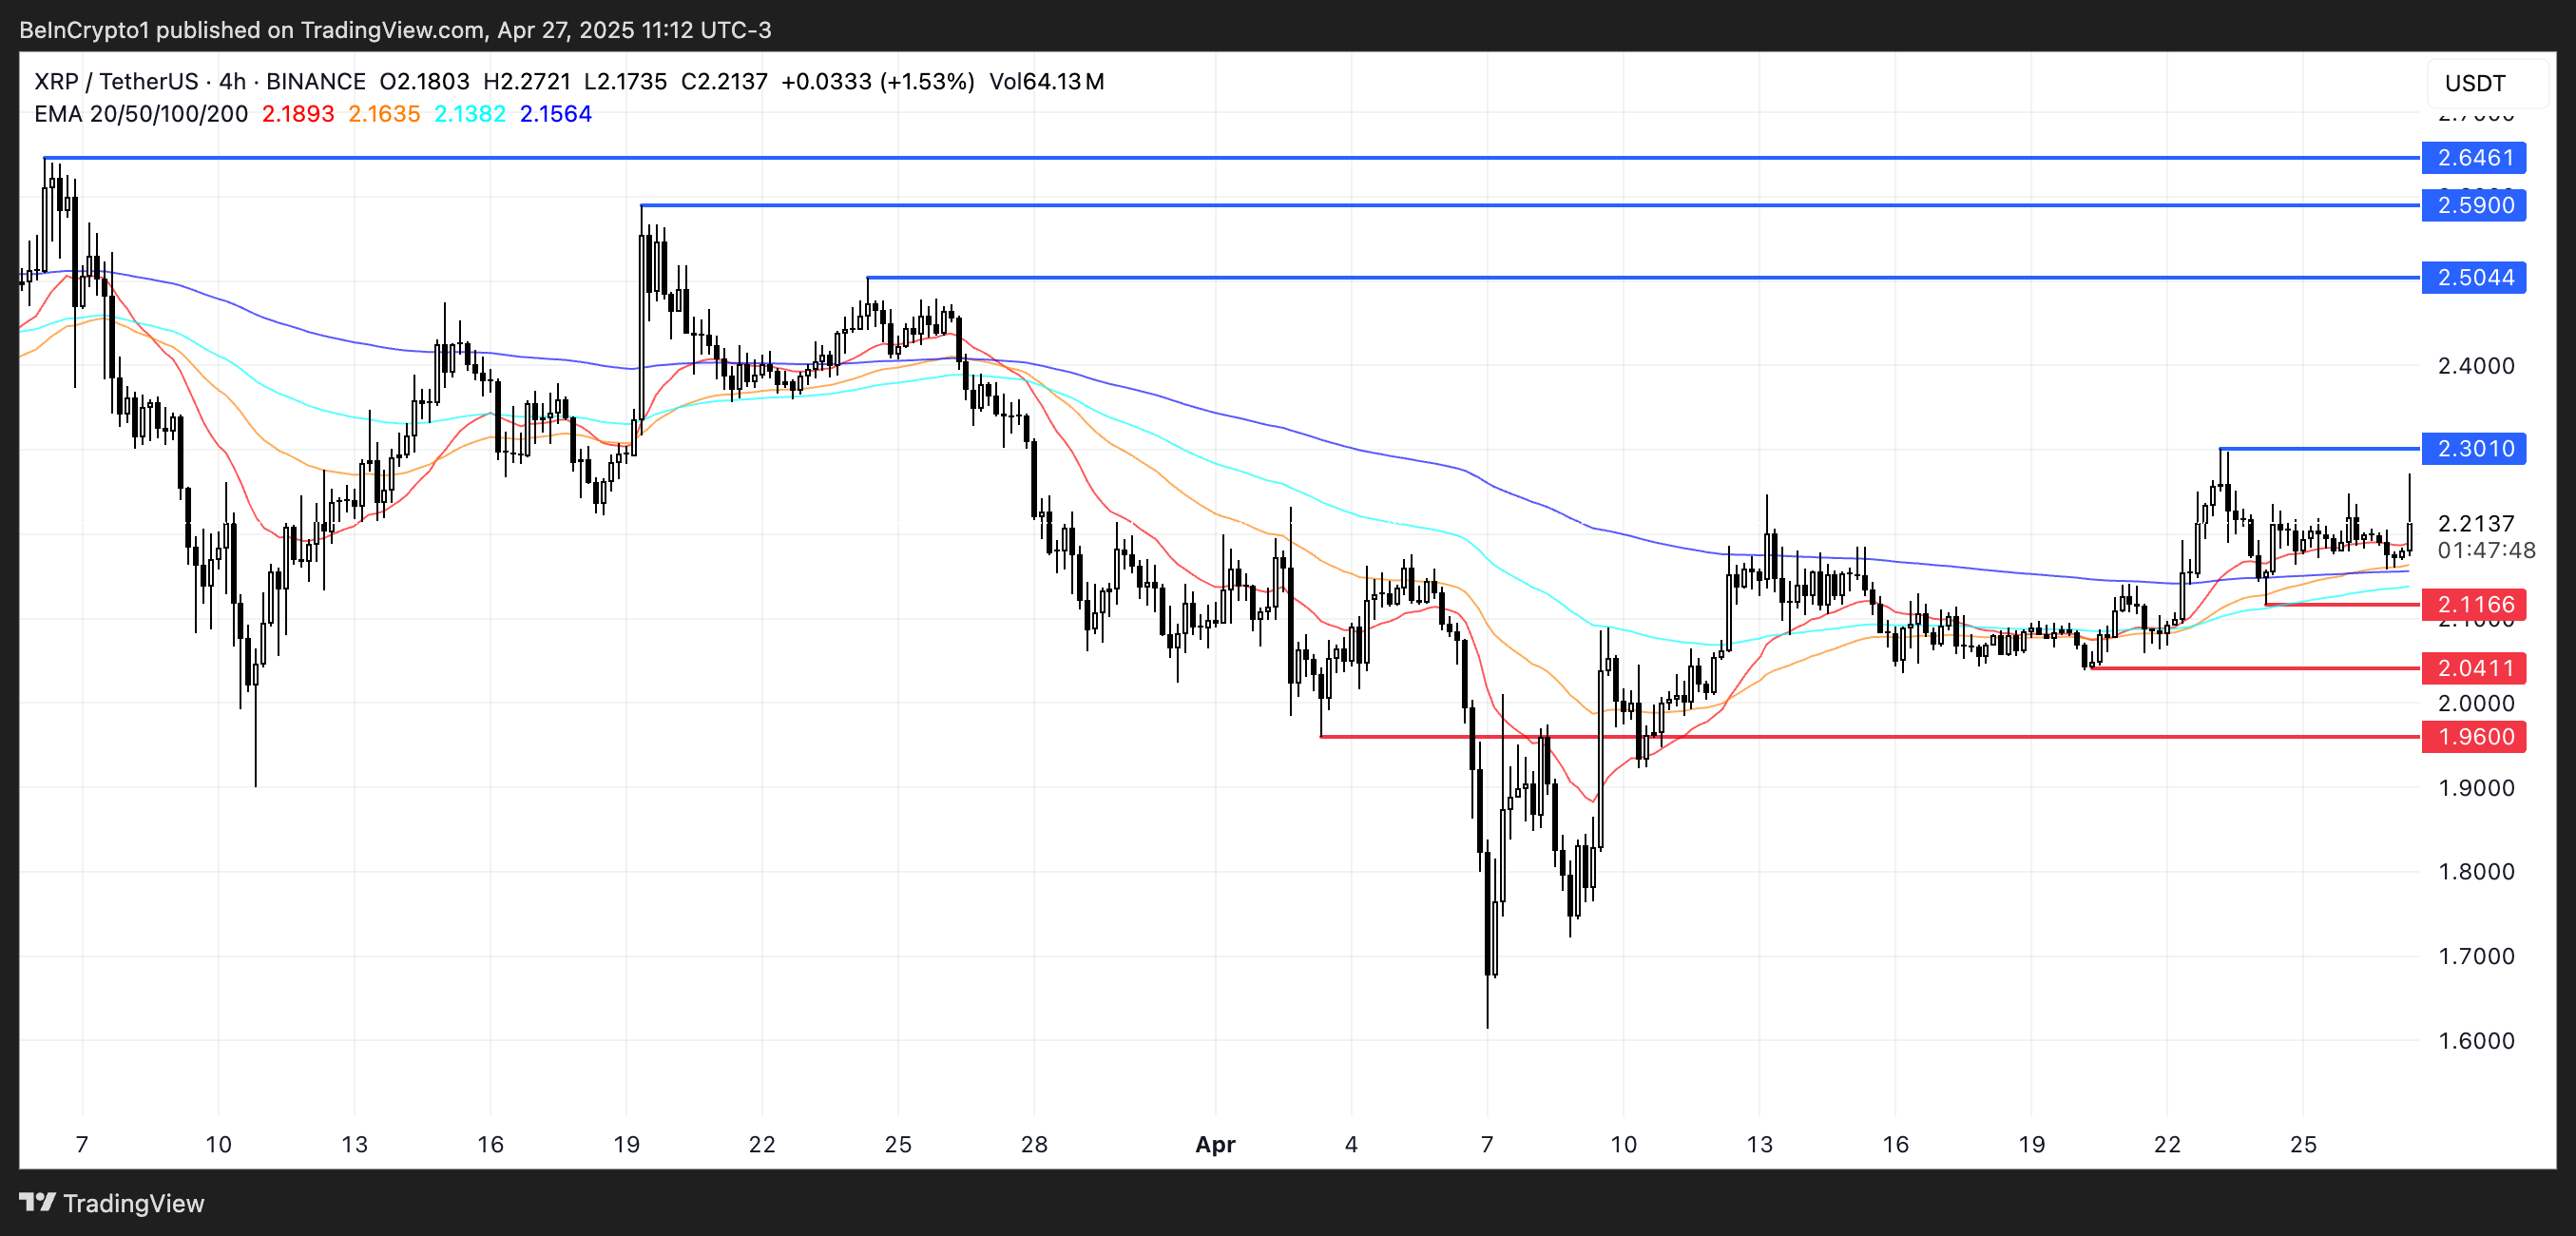
Should bearish momentum intensify further, a deeper retracement could see XRP test lower levels at $1.96, making it crucial for buyers to defend the current support zone.
Conversely, if XRP tests and breaks above the $2.30 resistance with strong bullish momentum, the next upside target would be around $2.50.
Continued strength could push the price toward $2.59, potentially extending to $2.64 if buyers maintain control.

Log in to Reply
Log in to comment your thoughtsComments
Related Articles
|Square
Get the BTCC app to start your crypto journey
Get started today Scan to join our 100M+ users