Pi Coin Defends $0.19 Support - But Retail Traders Face Critical Battle Below Key Level

Pi Coin's fragile stability faces its ultimate test as retail traders mount a desperate defense at the $0.19 threshold.
The Retail Resistance
Small-time holders dig trenches around the psychological support level, pouring capital into a digital Maginot Line that technical analysts say won't hold. Trading volumes suggest institutional players already positioned for the breakdown.
Technical Reality Check
Chart patterns scream distribution—smart money exiting while retail FOMO buys the dip. The 200-day moving average looms overhead like a concrete ceiling, with every rally attempt meeting immediate selling pressure.
Market Mechanics Exposed
Liquidity pools thin out below $0.19, creating a potential vacuum that could accelerate declines. Options positioning indicates professional traders betting heavily on a breakdown—because nothing says 'confidence' like Wall Street shorting your favorite coin.
The $0.19 line isn't just a price level—it's the financial equivalent of hoping your birthday wish comes true while the house burns down around you.
Retail Buying Stays Strong, But Momentum Points to Weakness
Retail traders are showing resilience, as seen through the Money FLOW Index (MFI) — an indicator that tracks buying and selling pressure using both price and volume. Between October 7 and October 14, Pi Coin’s price made a lower low (on the daily chart) while MFI formed a higher low. That’s a bullish divergence, meaning some dip-buying is happening even as prices fall.
Sign up for Editor Harsh Notariya’s Daily crypto Newsletter here.
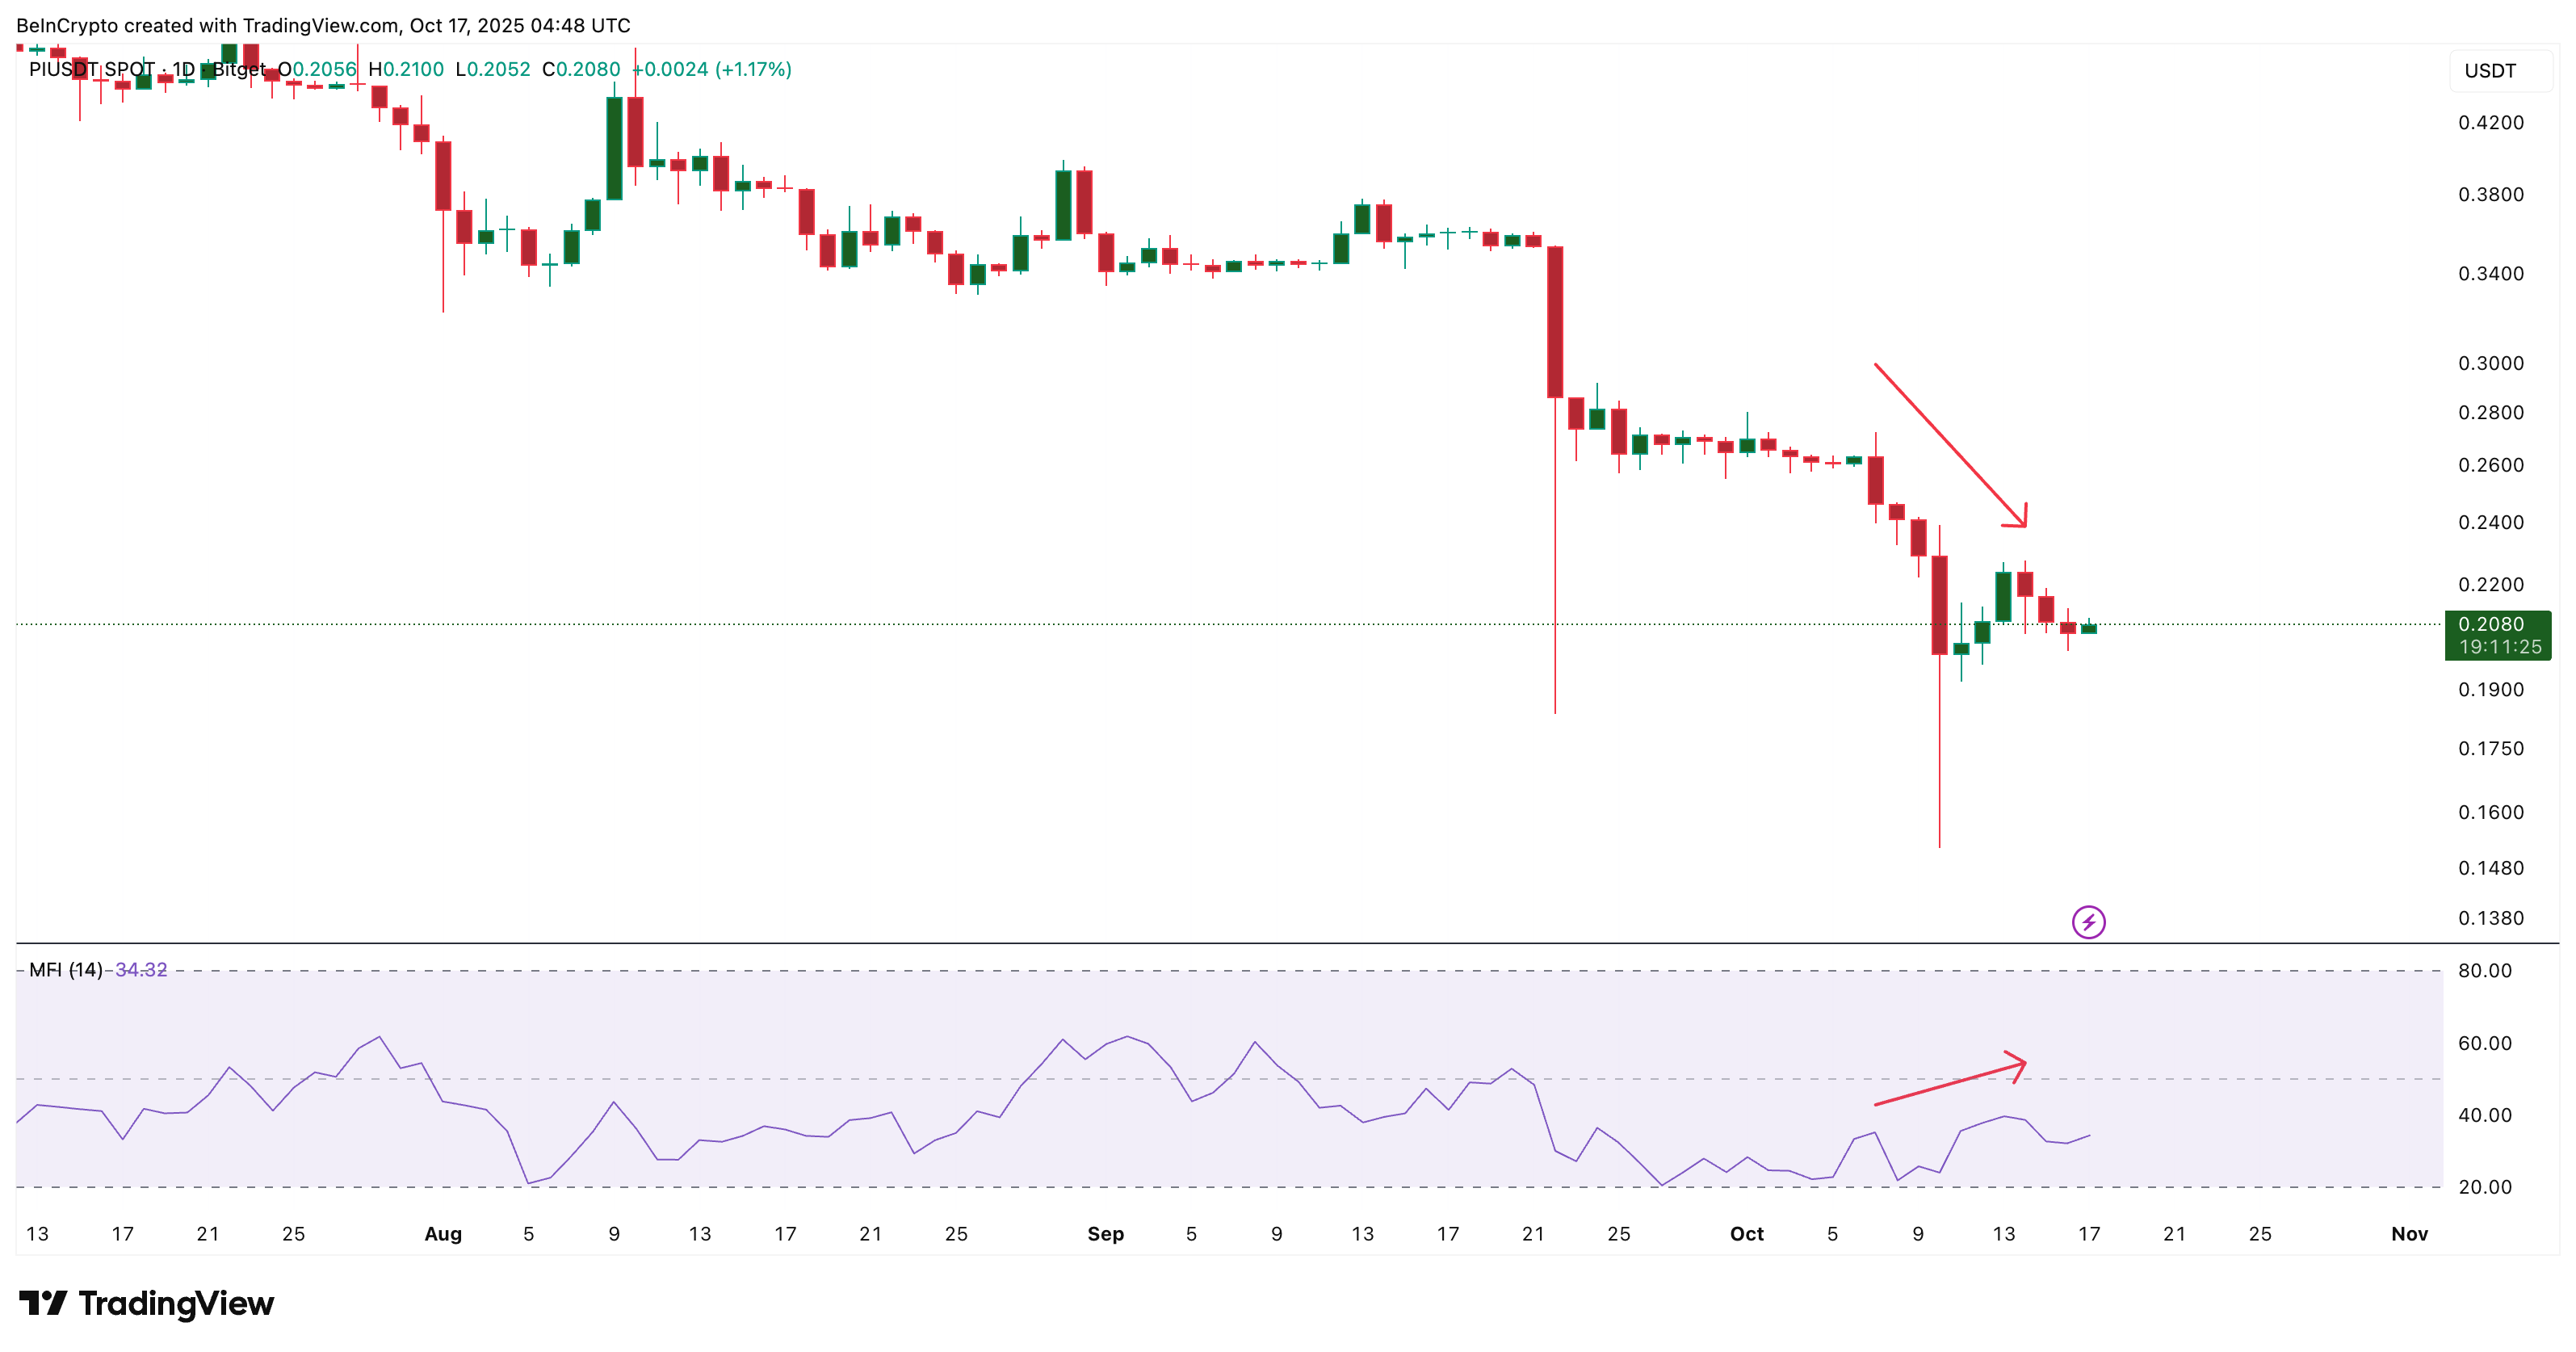
However, the Relative Strength Index (RSI) — which measures the speed and strength of price changes — paints a very different picture on the same chart.
Between October 6 and October 13, PI’s price made a lower high, while RSI climbed slightly higher. This is a hidden bearish divergence. And it often suggests that the broader downtrend is likely to continue despite short bursts of buying.
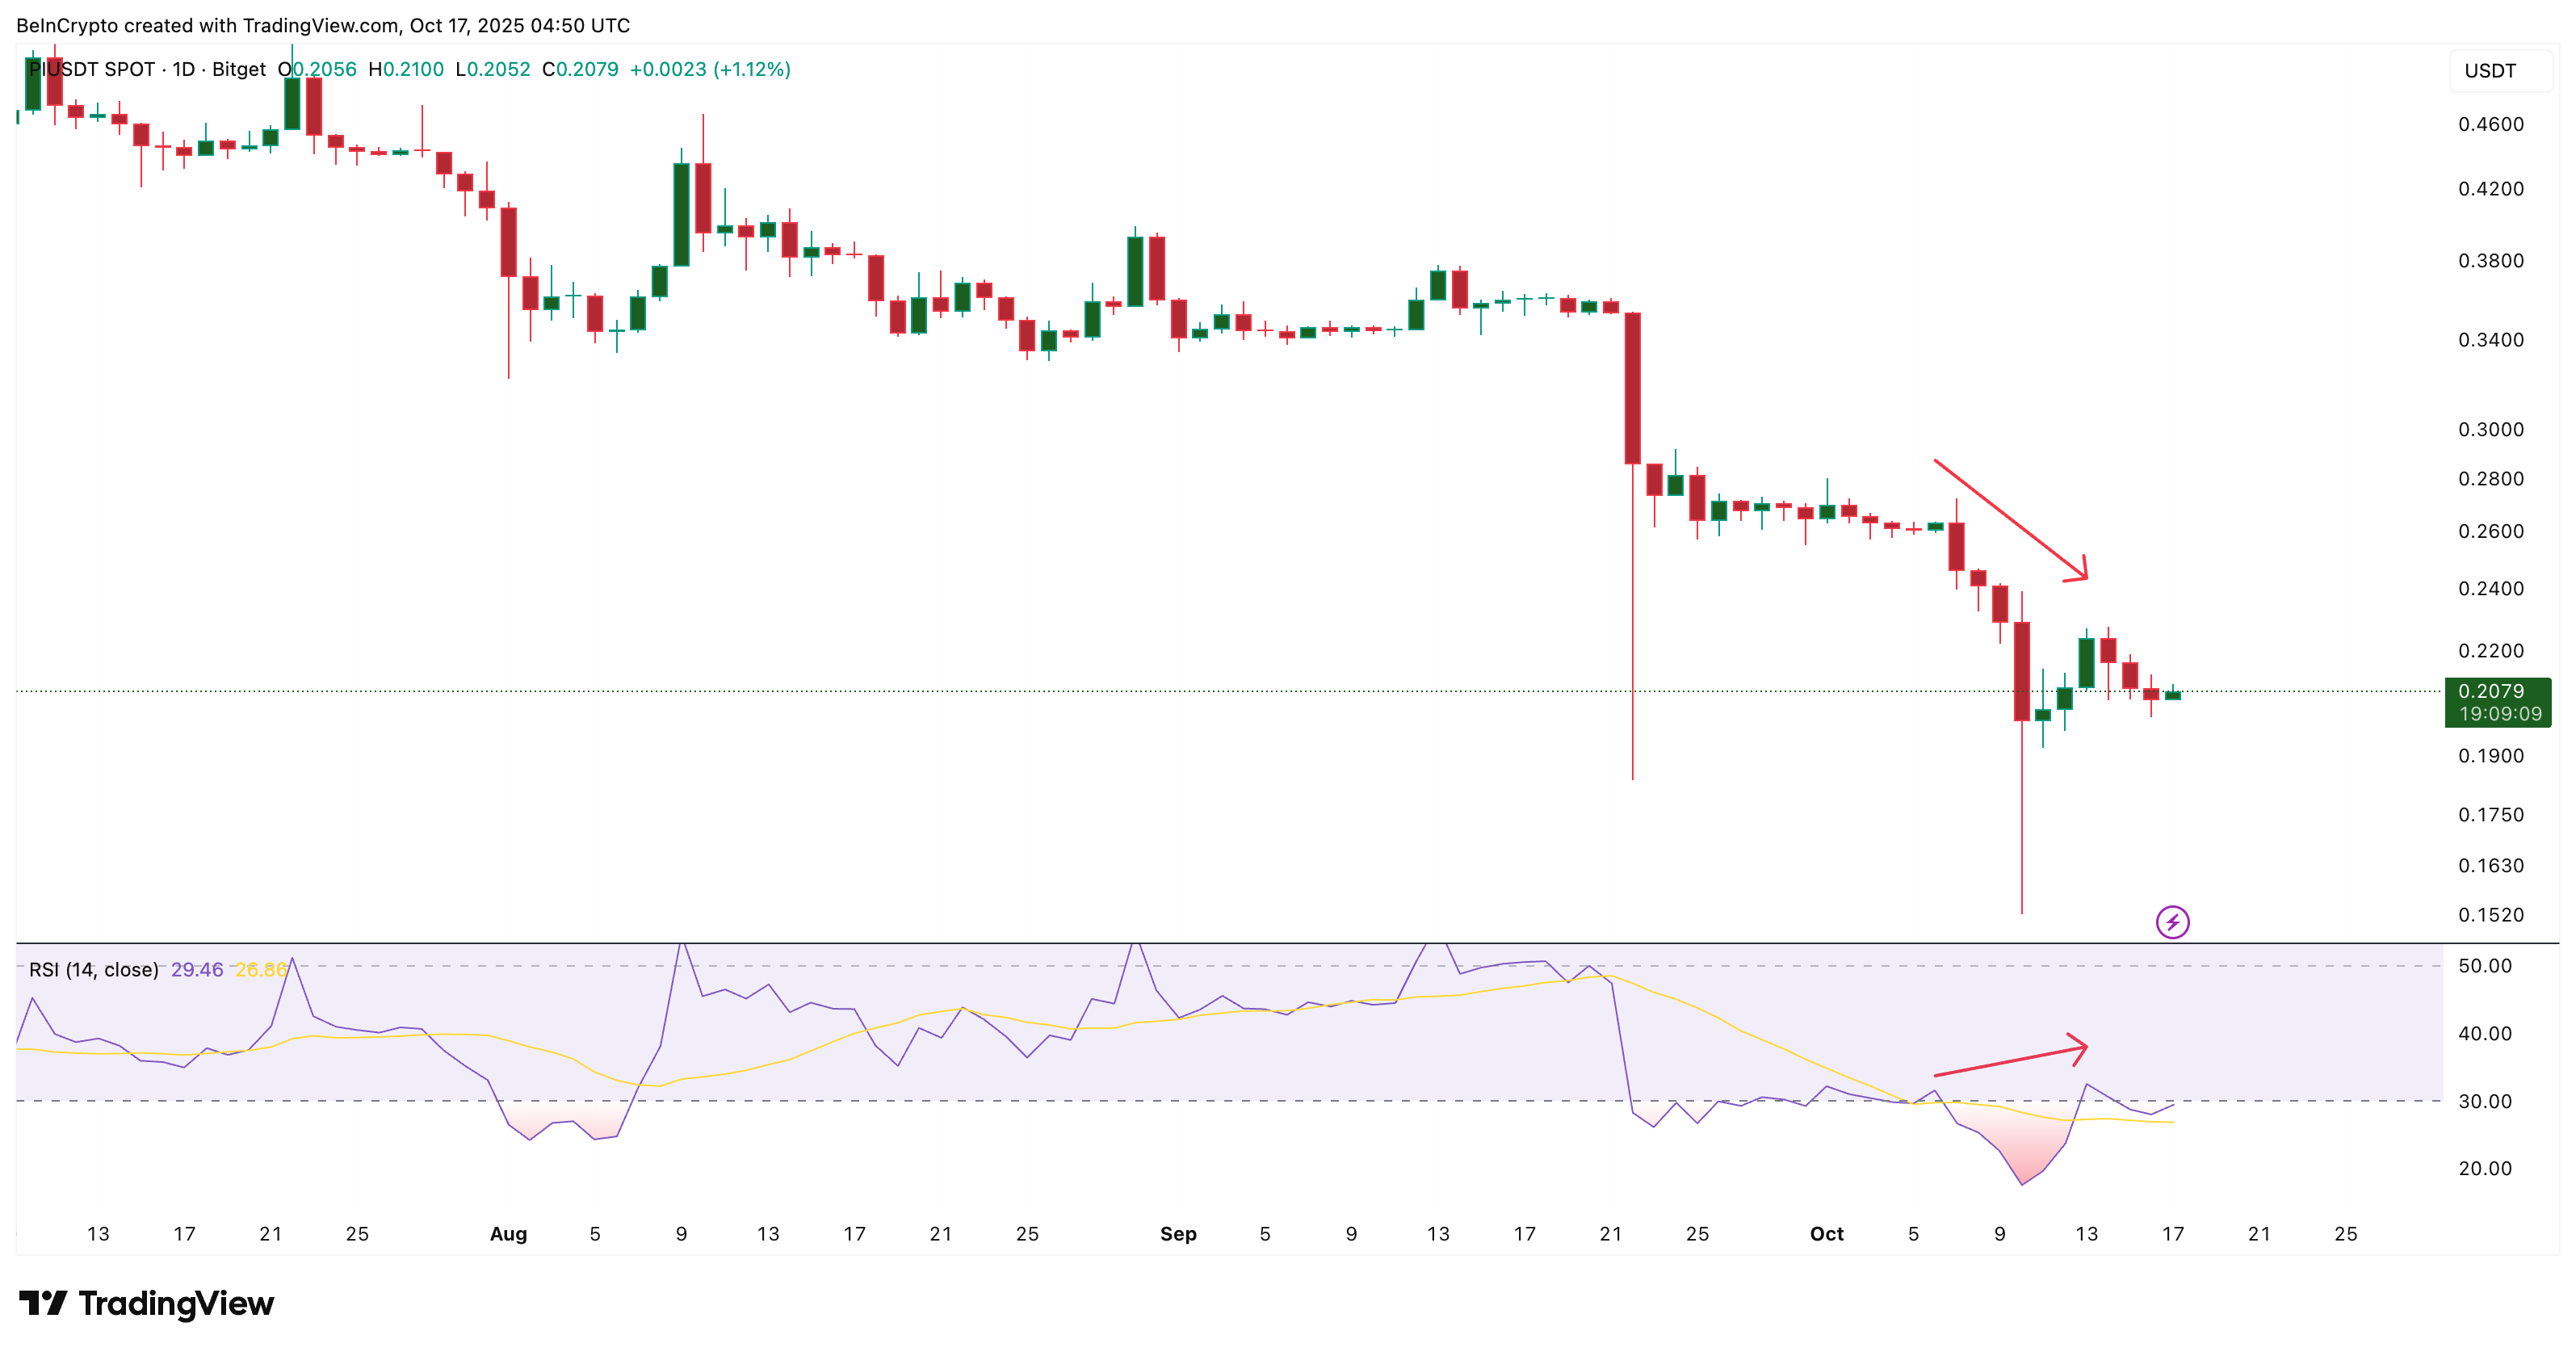
In short, the MFI shows that retail investors are trying to support the price, but RSI warns that momentum is still leaning bearish. This combination explains why Pi Coin has stayed stable for now, but with fading strength in the background.
Head-and-Shoulders Pattern Signals Pi Coin Price Breakdown Risk
While the daily PI Coin price chart highlights mixed momentum between retail buying and weakening strength, the 4-hour chart offers a closer look at early trend shifts — and it’s flashing warning signs.
On the shorter time frame, Pi Coin is forming a head-and-shoulders pattern. It is a setup that usually signals a correction when it appears inside a larger downtrend like PI’s. Unlike in long-term charts, where this pattern can hint at a full reversal, on shorter charts, it often points to a pause or continuation of the existing bearish move.
The formation WOULD complete below $0.199, which acts as the last significant support level near the neckline. If Pi Coin falls below this zone — and especially under $0.196 — it could confirm the breakdown. That would trigger a deeper correction of around 9.5%, targeting the next major support near $0.180.
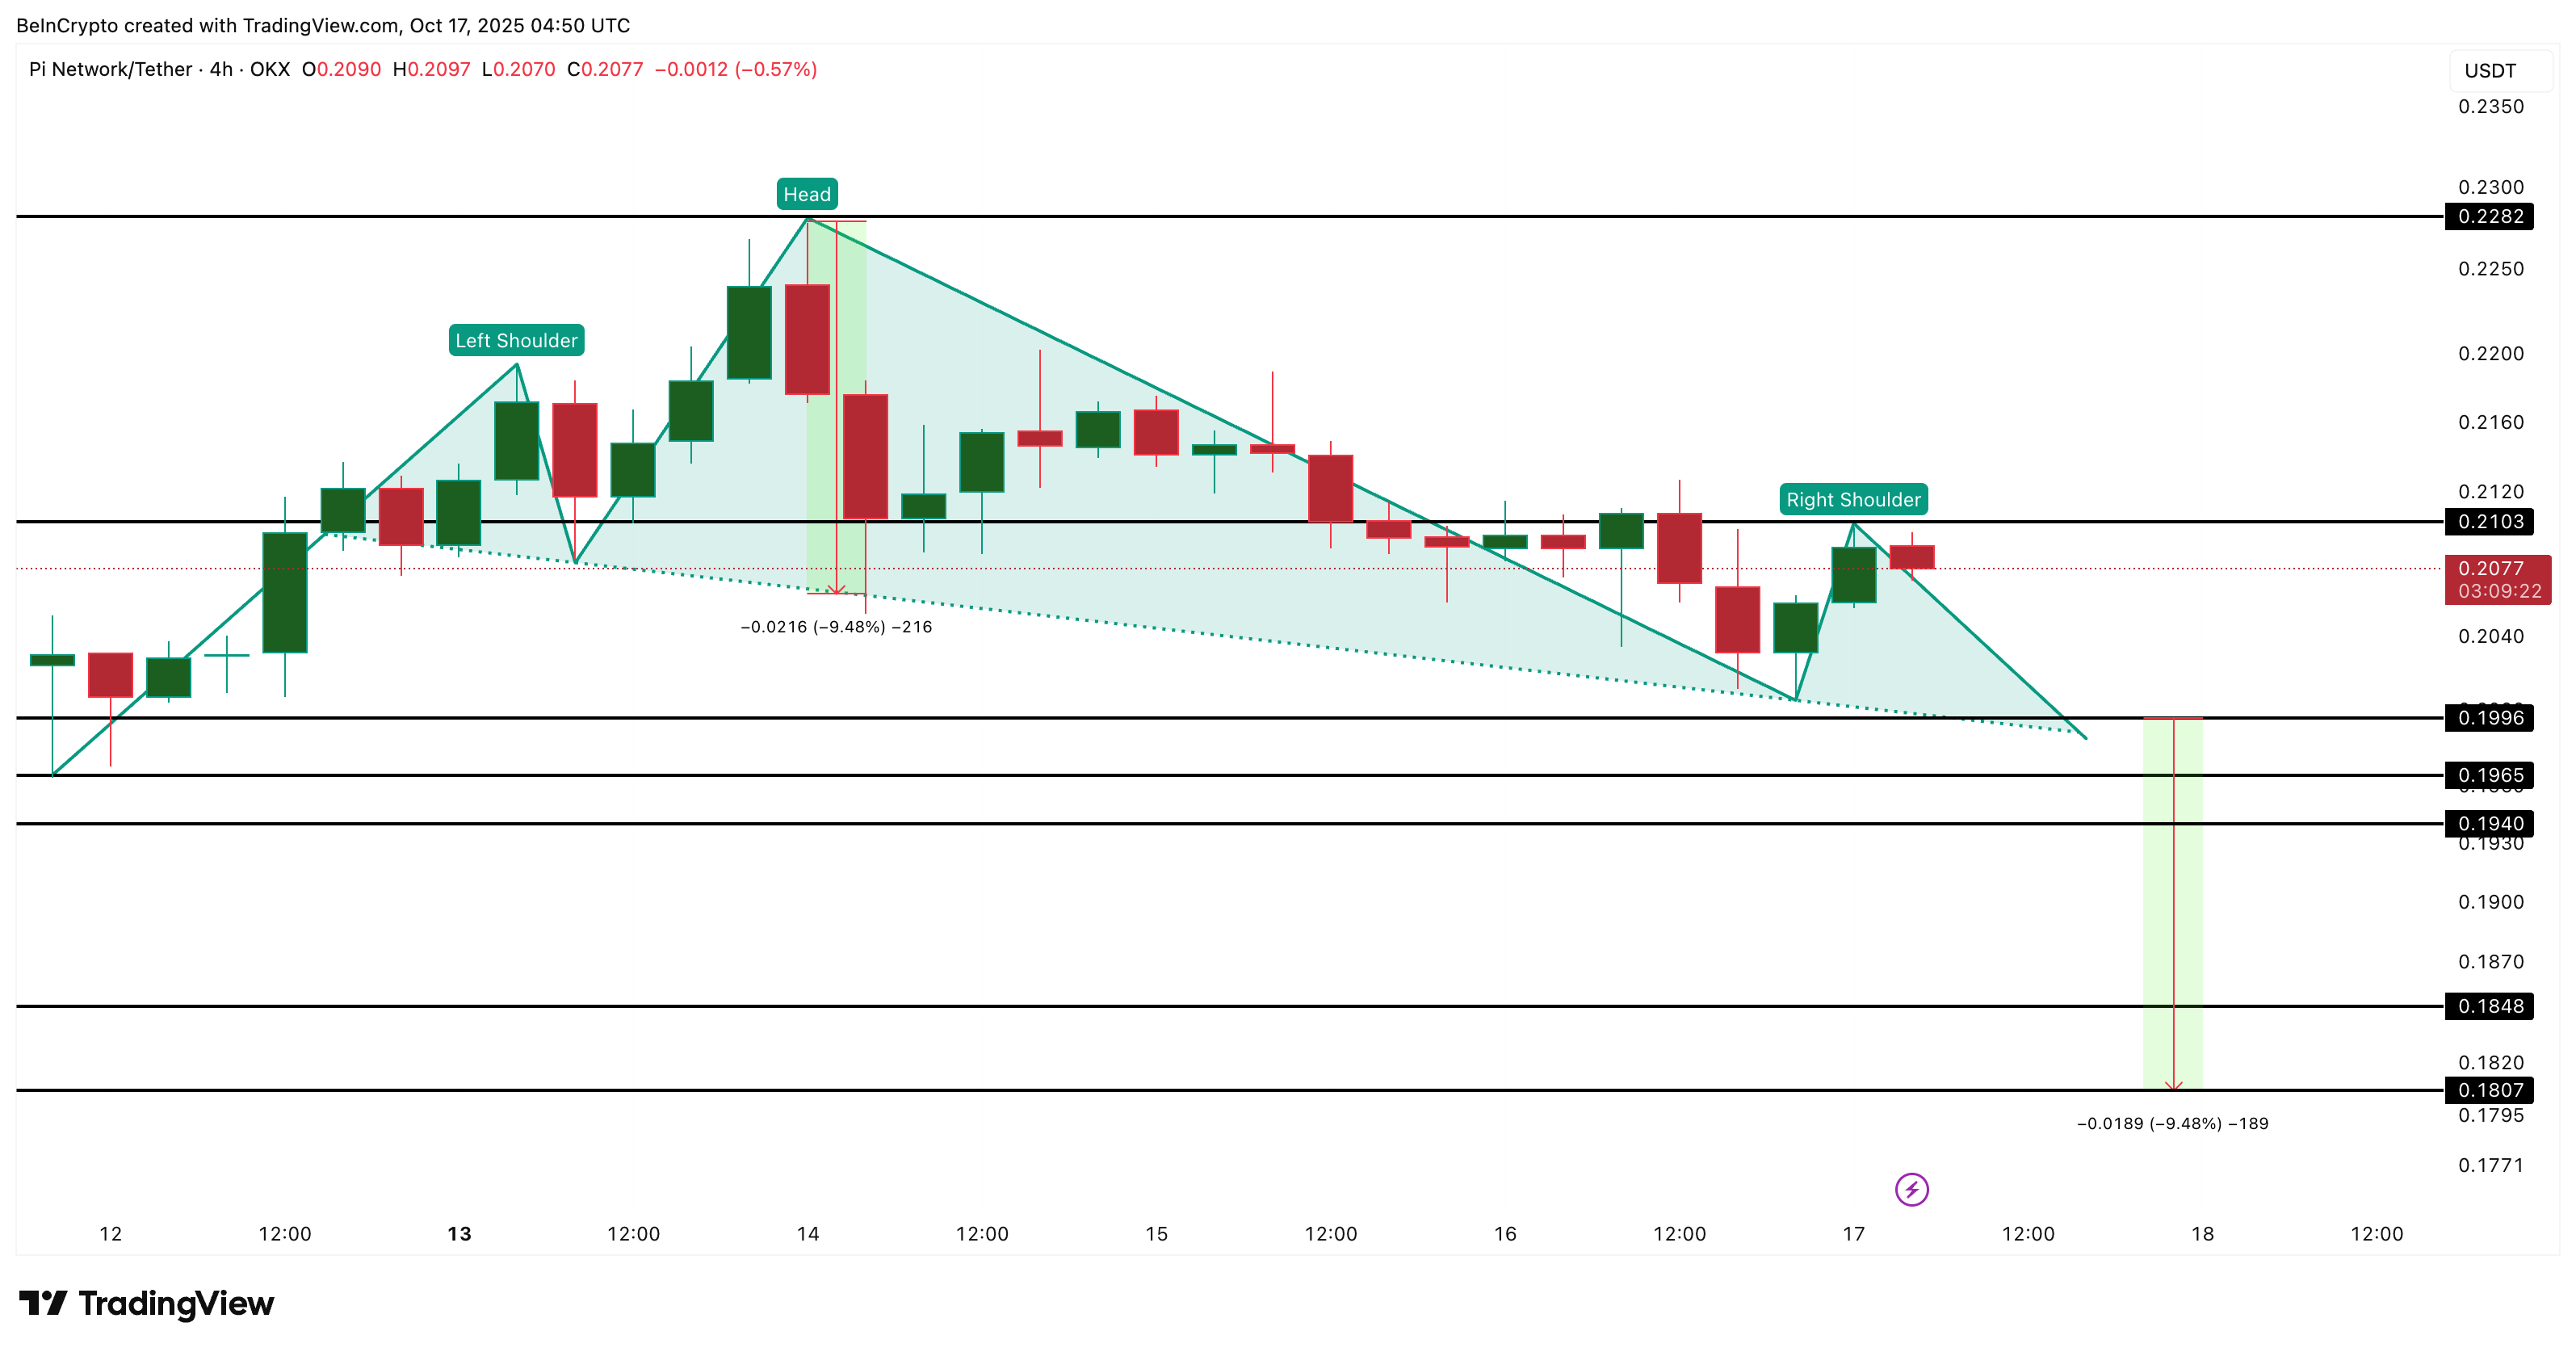
The neckline itself is sloping downward, showing that sellers are tightening control after each minor bounce.
For the bearish setup to fail, the Pi Price must close a 4-hour candle above $0.210. A stronger trend reversal would only start once the price breaks above $0.228, the existing head of the bearish pattern.
Until then, the risk of another decline remains high. Retail buying may keep PI temporarily stable, but the charts still favor sellers. If $0.199 breaks, the token’s next MOVE could be another leg lower in its broader downtrend.
