XRP Plummets: Is the $3 Support Level at Risk in 2025?

- Why Is XRP Under Heavy Selling Pressure?
- Technical Analysis: A Make-or-Break Moment
- Indicators Flash Warning Signs
- Exchange Data Tells a Bearish Tale
- Historical Context: How Deep Could This Go?
- What’s Next for XRP?
- XRP Price Crisis: Your Questions Answered
XRP is facing a critical juncture as its price tumbles, threatening the key psychological support at $3. With a 13% drop from its recent all-time high of $3.65 and bearish technical indicators dominating, traders are bracing for potential further declines. This analysis dives into the charts, market sentiment, and expert insights to unpack whether XRP can hold its ground or if deeper corrections loom.
Why Is XRP Under Heavy Selling Pressure?
XRP started July 24, 2025, with a sharp 5% drop within 24 hours, according to CoinGecko data. The token has now retreated over 13% from its peak of $3.65, sparking concerns about its near-term trajectory. The sell-off appears driven by a combination of profit-taking after its recent rally and growing bearish sentiment across crypto markets. On-chain data shows sell orders outpacing buys by $1 billion in 24 hours—a clear red flag.
![]()
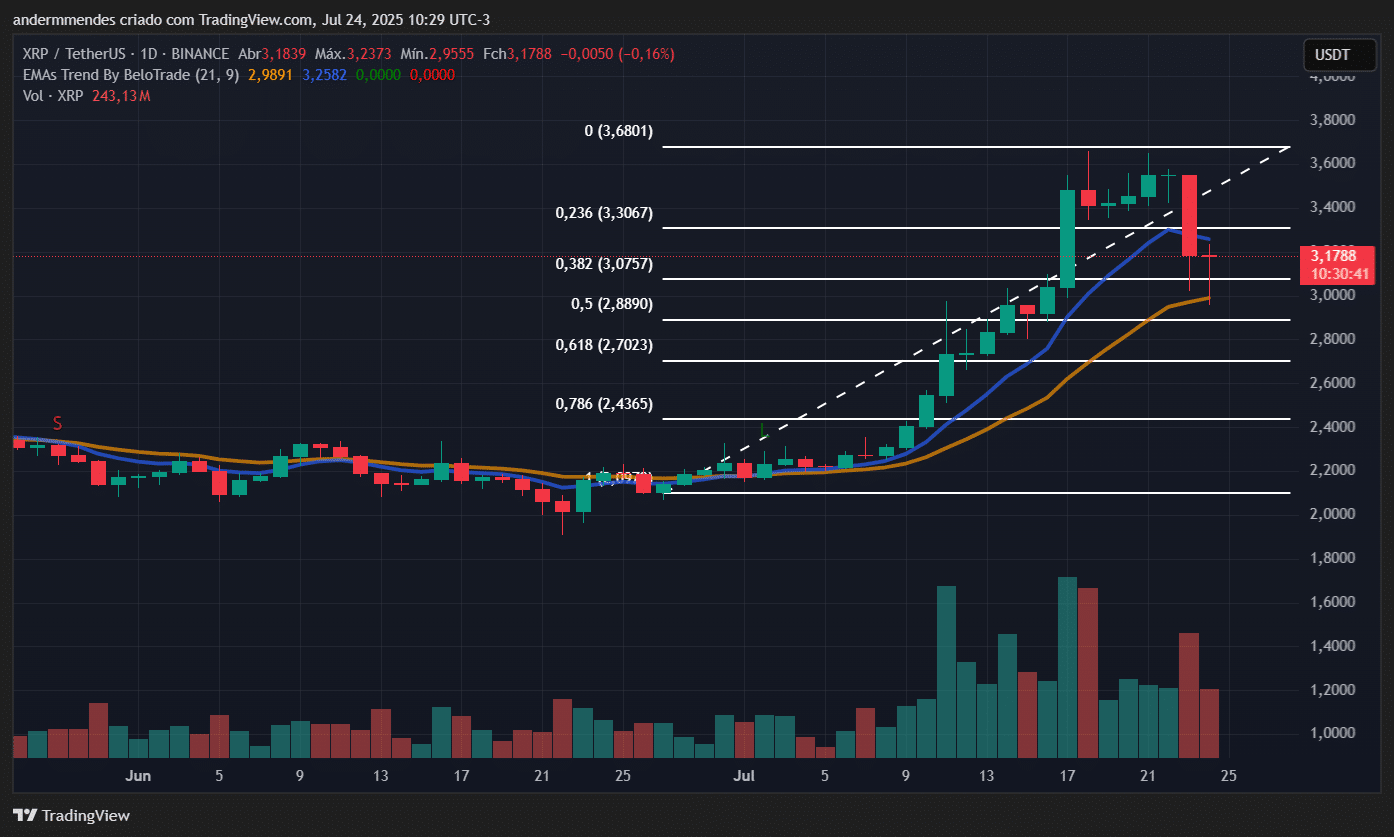
Technical Analysis: A Make-or-Break Moment
The daily chart reveals XRP testing the 21-day Exponential Moving Average (EMA), a critical support level it hasn’t closed below since June. If this level holds, we could see a rebound toward previous highs. However, the 4-hour chart paints a grimmer picture: the 9- and 21-period EMAs have crossed bearishly, and the $3.35 support has already broken. Next targets? Fibonacci retracement levels at $2.87 (50%) and $2.69 (61.8%), which WOULD mean another 10-15% drop.
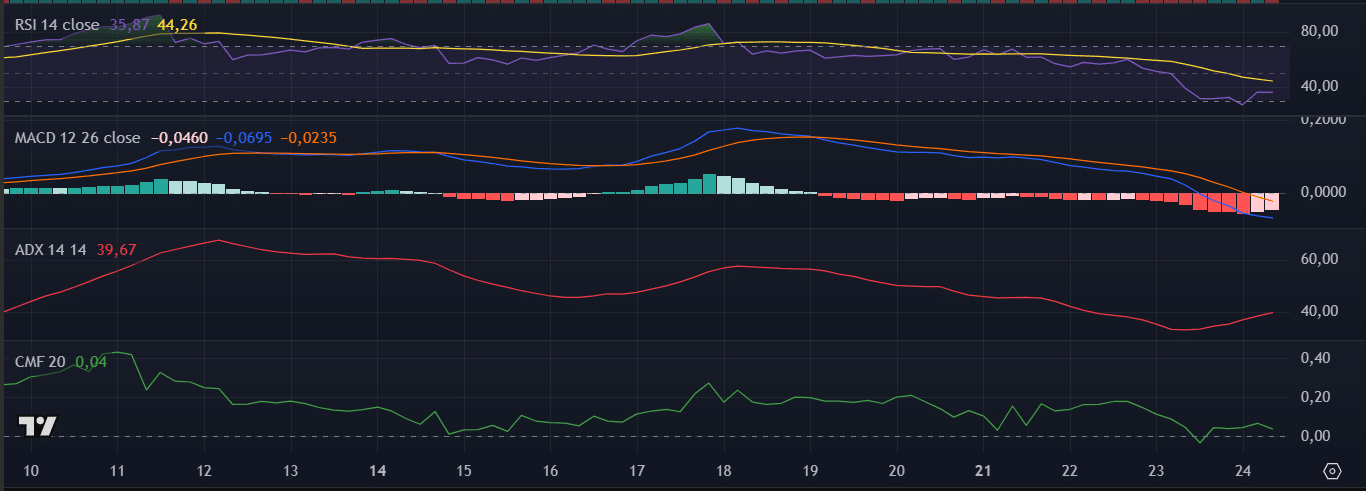
Indicators Flash Warning Signs
The RSI has dipped below 50 (neutral), signaling weakening buying momentum. Meanwhile, the MACD’s bearish crossover and negative histogram bars confirm seller dominance. The ADX above 40 suggests this downtrend has legs. Even the Chaikin Money Flow (CMF), though still positive, is declining—hinting at dwindling capital inflow. "This isn’t just a pullback; it’s a structural shift," notes a BTCC market analyst. "Traders should watch the $3 level like hawks."
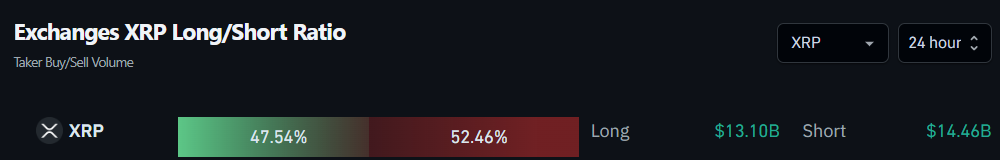
Exchange Data Tells a Bearish Tale
Platforms like BTCC and Binance show long/short ratios skewing heavily toward shorts. The derivatives market echoes this: open interest in XRP futures has dropped 8% as traders unwind bullish positions. "The crowd’s leaning bearish, but remember—markets love to punish the majority," quips a veteran trader on Crypto Twitter.
Historical Context: How Deep Could This Go?
In June 2024, XRP saw a similar 18% correction before rallying 40%. The key difference? Back then, the CMF stayed firmly positive. This time, with weakening volume and broken supports, the risk of a deeper plunge rises. That said, the $3 zone has been a psychological battleground since 2023—if it holds, dip-buyers might swarm in.
What’s Next for XRP?
All eyes are on the $3 support. A bounce here could reignite the uptrend, targeting $3.65 again. But if it cracks, prepare for volatility. The mid-$2 range could become the new playground. Either way, strap in—this rollercoaster isn’t stopping soon.
XRP Price Crisis: Your Questions Answered
How low can XRP go if $3 breaks?
Fibonacci levels suggest $2.87 (50% retracement) and $2.69 (61.8%) as next supports. A drop to these levels would mean a 10-15% further decline from current prices.
Are there any bullish signals left for XRP?
Yes—if the 21-day EMA holds and RSI rebounds above 50, we could see a reversal. The ADX’s strength also means any uptrend would have momentum.
Should I buy XRP now?
This article does not constitute investment advice. That said, seasoned traders often wait for confirmation (e.g., a daily close above $3.20) before entering.
