Bitcoin Price Prediction 2025: Why a Year-End Rally Looks Inevitable as Institutional Demand Surges

- Technical Analysis: Why Bitcoin's Chart Setup Screams "Buy"
- Institutional Tsunami: How Wall Street Is Reshaping Bitcoin's Market
- The Swiss Surprise: How Grocery Stores Are Driving Mainstream Adoption
- ETF Wars: How BlackRock Is Reshaping Bitcoin's Supply Dynamics
- Historical Patterns: Why December Could Deliver Big Gains
- Risks to Watch: Dormant Coins and Macro Uncertainty
- Price Prediction: Where Could BTC End 2025?
- Investment Strategy: How to Position for the Rally
- Frequently Asked Questions
As we approach the final weeks of 2025, bitcoin (BTC) is showing all the classic signs of gearing up for its traditional year-end rally. Currently trading at $92,822 with strong institutional inflows and technical indicators flashing bullish signals, crypto analysts are increasingly confident about BTC's upside potential. This in-depth analysis examines the 8 key factors driving Bitcoin's price action, from BlackRock's record ETF volumes to surprising developments in Swiss supermarkets. We'll break down the technical setup, institutional tailwinds, and historical patterns that suggest December could deliver significant gains for BTC holders.
Technical Analysis: Why Bitcoin's Chart Setup Screams "Buy"
Bitcoin's technical indicators paint an overwhelmingly bullish picture as we head into December 2025. The cryptocurrency is currently trading comfortably above its 20-day moving average ($90,222), which has historically served as reliable support during uptrends. The Bollinger Bands are expanding - a classic volatility signal that often precedes big moves - with the upper band sitting at $96,470 (potential resistance) and the lower band at $83,973 (strong support).
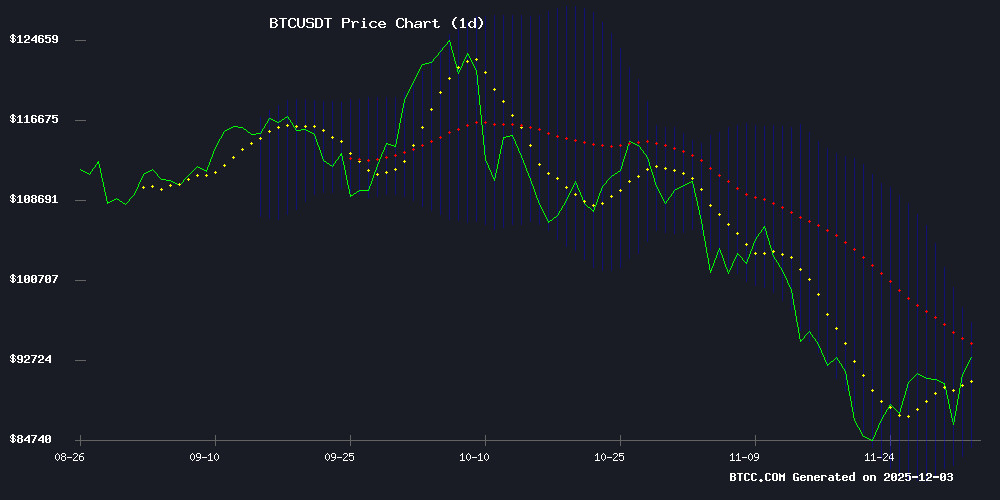
While the MACD shows short-term bearish momentum (-2,263), this appears to be a temporary pullback within a larger bullish structure. "We're seeing textbook accumulation patterns," notes the BTCC research team. "The 20-day MA has held as support through three separate tests in November, and volume profiles suggest institutions are buying these dips."
Institutional Tsunami: How Wall Street Is Reshaping Bitcoin's Market
The institutional adoption narrative reached new heights in November 2025, with several landmark developments:
- BlackRock's Bitcoin ETF (IBIT) hit $3.7 billion in daily volume - surpassing many traditional ETFs
- Tokenized real-world assets (RWAs) on blockchain networks crossed $24 billion
- Bank of America began recommending 1-4% crypto allocations for client portfolios
- Vanguard reversed its anti-crypto stance to allow Bitcoin ETF trading
What's particularly striking is how quickly institutional participation is maturing. Glassnode data shows Bitcoin's 90-day settlement volume now rivals Visa at $6.9 trillion, while realized volatility has dropped 50% year-over-year - both hallmarks of an asset class transitioning from speculative to strategic.
The Swiss Surprise: How Grocery Stores Are Driving Mainstream Adoption
In a development that would have seemed absurd just five years ago, Swiss supermarket chain SPAR has rolled out cryptocurrency payments across 100+ locations, with plans to expand to 300 stores. The system uses OpenCryptoQR codes that work with popular wallets like Binance Pay, instantly converting crypto to Swiss francs at checkout.
"This isn't just about payments - it's about normalizing crypto in everyday life," observes a retail analyst familiar with the rollout. The MOVE cuts payment processing fees by two-thirds compared to credit cards while eliminating gas fees when using Binance Pay. Following successful Lightning Network trials in Zug (Switzerland's "Crypto Valley"), SPAR's initiative represents the most significant retail crypto integration in European history.
ETF Wars: How BlackRock Is Reshaping Bitcoin's Supply Dynamics
The numbers tell a staggering story: BlackRock's IBIT now holds 3.88% of all circulating Bitcoin after accumulating $66.2 billion in volume since launch. November's $3.7 billion volume record eclipsed mainstream offerings like Vanguard's S&P 500 ETF (VOO), signaling unprecedented Wall Street demand.
This institutional hunger is creating unique supply pressures. With daily miner issuance at just 900 BTC and ETFs sucking up thousands of coins weekly, the available liquid supply continues shrinking. "We're seeing the early stages of a supply crunch," warns a BTCC market strategist. "If this demand persists into 2026, the price implications could be dramatic."
Historical Patterns: Why December Could Deliver Big Gains
Bitcoin has developed a reliable seasonal pattern of December rallies, with average gains of 12.3% over the past decade. Several factors make this December particularly ripe for a repeat:
| Factor | 2025 Context |
|---|---|
| Institutional Year-End Portfolio Rebalancing | Bank of America's new 1-4% allocation recommendation takes effect |
| Reduced Miner Selling Pressure | Post-halving supply shock fully manifesting |
| Tax-Loss Harvesting Rebound | November's 32% pullback created ideal setup |
HSBC strategist Max Kettner notes: "This dip looks closer to a buy signal than a sell signal. Historically, when Bitcoin holds above its 20-week MA in December, the year-end rally tends to be particularly strong."
Risks to Watch: Dormant Coins and Macro Uncertainty
Not all signals are bullish. On-chain analysts have detected unusual movement from "dormant" Bitcoin wallets (inactive for 3-5 years), which historically precede major market turns. Meanwhile, the Federal Reserve's ambiguous rate policy creates macro uncertainty, though most traders now expect cuts in early 2026.
The Australian Bitcoin Industry Body's recent complaint against ABC News highlights another risk - media narratives. "When mainstream outlets misrepresent Bitcoin solely as a tool for criminals while ignoring its energy grid stabilization and humanitarian applications, it creates artificial headwinds," argues ABIB spokesperson.
Price Prediction: Where Could BTC End 2025?
Based on current technicals, institutional flows, and historical patterns, several price scenarios seem plausible:
- Bull Case ($105,000): ETF inflows accelerate while supply remains constrained
- Base Case ($97,500): December seasonal patterns hold with average gains
- Bear Case ($83,000): Dormant coin movement signals distribution
The BTCC technical team notes: "The $96,470 upper Bollinger Band represents immediate resistance, but if institutional volumes persist, we could see a breakout toward six figures before New Year's."
Investment Strategy: How to Position for the Rally
For investors looking to capitalize on Bitcoin's year-end potential, several strategies emerge:
- Dollar-Cost Average (DCA): Systematic buying below $90k to reduce volatility impact
- ETF Exposure: Institutions clearly prefer the regulated wrapper
- Volatility Plays: Options strategies to benefit from expected December moves
"This isn't the time to get cute with timing," cautions a BTCC analyst. "The institutional adoption story is real, and trying to perfectly time entries could mean missing substantial upside."
Frequently Asked Questions
What is Bitcoin's current price and technical outlook?
As of December 3, 2025, Bitcoin trades at $92,822, showing bullish technical signals including position above key moving averages and Bollinger Band expansion suggesting increased volatility ahead.
How significant is BlackRock's Bitcoin ETF volume?
BlackRock's $3.7 billion daily volume represents unprecedented institutional demand, with the ETF now holding nearly 4% of circulating BTC supply - creating potential supply constraints.
Why does SPAR's crypto payment matter?
SPAR's rollout across 100+ Swiss stores marks Europe's largest retail crypto integration, reducing payment fees by 66% and normalizing cryptocurrency use in daily commerce.
What historical patterns suggest a December rally?
Bitcoin has averaged 12.3% December gains over the past decade, with institutional year-end rebalancing and reduced miner selling pressure creating favorable seasonal conditions.
What are the key resistance and support levels?
Immediate resistance sits at the upper Bollinger Band ($96,470), while strong support emerges at the 20-day MA ($90,222) and lower Bollinger Band ($83,973).
