Bitcoin’s Next Move: Navigating the Aftermath of a $160 Million Market Shakeout

Blood in the streets? Bitcoin's latest $160 million liquidation event has traders scrambling—but the smart money sees opportunity.
Here's what the charts won't tell you about crypto's recovery playbook.
When leveraged longs get vaporized, cold-blooded accumulators start licking their chops. The market just handed retail traders another expensive lesson in overconfidence.
Meanwhile, Wall Street's 'risk management' desks are still trying to explain why their Bitcoin ETFs bought the top. Again.
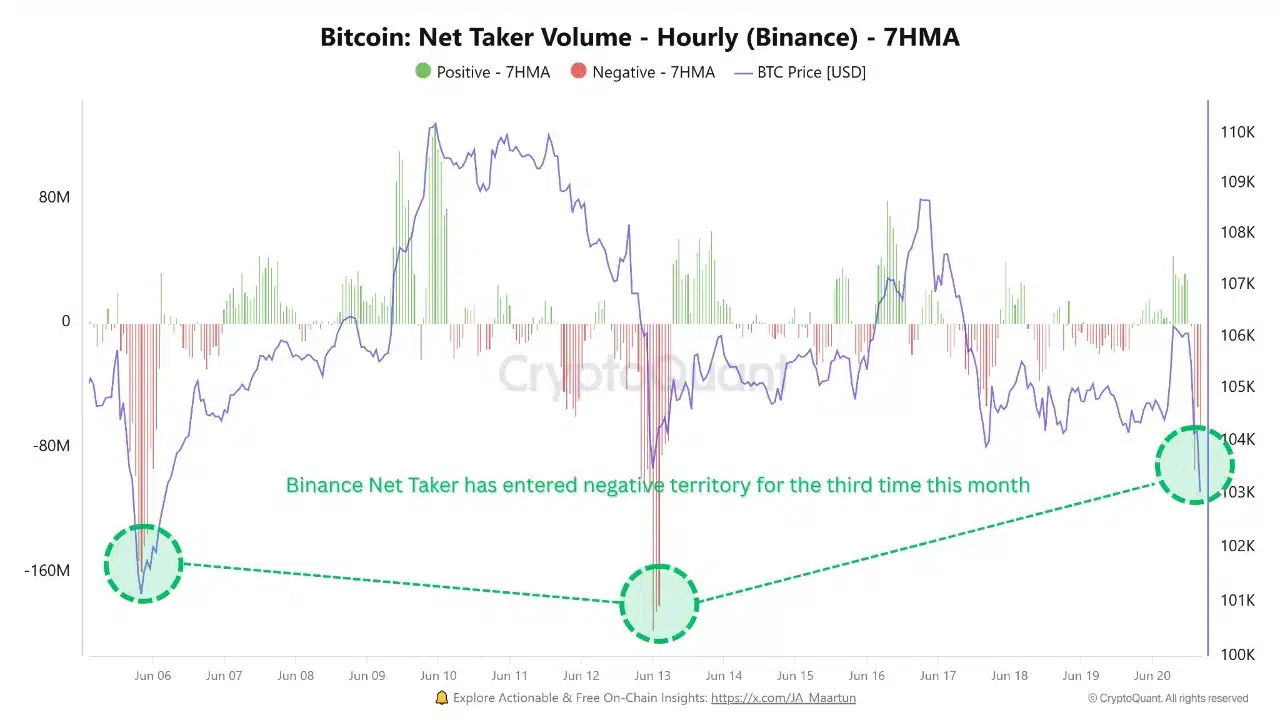
Source: CryptoQuant
Capitulation or cleansing?
Now here’s where it gets more layered. BTC’s 7-day Realized Cap fell to $33.48 billion, while the 1-day variant collapsed to $1.11 billion, according to Santiment.
This steep contraction revealed diminished realized profits and fading market participation.
Rather than pure bearishness, this compression signals potential deleveraging. It suggests that short-term speculation may be getting flushed out of the system, possibly setting the stage for a more stable buildup.

Source: Santiment
Are STHs stepping back?
BTC’s short-term holder activity plunged, evidenced by the Realized Cap HODL Waves (1d to 7d) dropping from above 8% to nearly 3.6%.
These market participants, often driven by HYPE or panic, have capitulated.
At the same time, the Stock-to-Flow (S2F) Ratio surged to 335—its highest level this cycle—indicating extreme supply scarcity.
Together, this combo of seller exhaustion and supply constraints paints the early signs of recovery potential.

Source: Santiment
Does THIS point to sidelined firepower ready to deploy?
Now let’s talk liquidity. The Exchange Stablecoin Ratio sat at 5.45, with a -1.23% daily change. This means stablecoins now make up a higher share of assets on exchanges.
A declining ratio often shows stronger potential buying power, as more funds remain in reserve rather than being deployed.
Liquidity hasn’t fled the market; it’s on standby. If sentiment stabilizes, that capital may quickly rotate into BTC positions.

Source: CryptoQuant
Will bears stay in control?
BTC traded around $103,569, just below the 0.236 Fibonacci level at $105,245, at press time. Despite this, it held the $102K support line through multiple tests.
Meanwhile, the 9-day and 21-day moving averages have yet to flip bullish.
If bulls reclaim the 0.382 or 0.5 levels, upward momentum could build toward the $110K–$112K range.
Therefore, while the structure looks shaky, BTC still holds a chance to bounce if accumulation strengthens NEAR this range.

Source: TradingView
Is the worst behind, or could BTC face more downside?
Bitcoin’s $160M liquidation flush, paired with negative Net Taker Volume and collapsing short-term conviction, suggests the market has cleared excessive leverage.
At the same time, extreme scarcity and available buying power hint at a brewing reversal.
Therefore, while caution remains necessary, the odds are tilting toward a stabilization phase that may support gradual recovery if bulls defend the $102K–$103K range.
Subscribe to our must read daily newsletter

Log in to Reply
Log in to comment your thoughtsComments
Related Articles
|Square
Get the BTCC app to start your crypto journey
Get started today Scan to join our 100M+ users