Fed Rate Cut Ignites Crypto Surge: Bitcoin, Cardano and NEAR Charts Reveal Explosive Momentum

Crypto markets roar back to life as Federal Reserve policy shift sends digital assets soaring—technical patterns suggest this rally has legs.
Bitcoin Breaks Key Resistance
BTC smashed through critical resistance levels with conviction, fueling optimism among bulls. The move signals potential sustained upward momentum rather than a dead-cat bounce.
Cardano's Smart Contract Revival
ADA's chart shows renewed developer activity driving network growth—proof that fundamentals still matter when the macro tides turn favorable.
NEAR Protocol's Ecosystem Surge
The layer-1 blockchain demonstrates remarkable resilience, with user adoption metrics painting a bullish picture for continued outperformance.
While traditional finance scrambles to understand what just hit them, crypto's rebound proves once again that decentralized markets move faster than Fed printers—and make far better investments than over-leveraged bank stocks.
Bitcoin: Consolidating near record territory
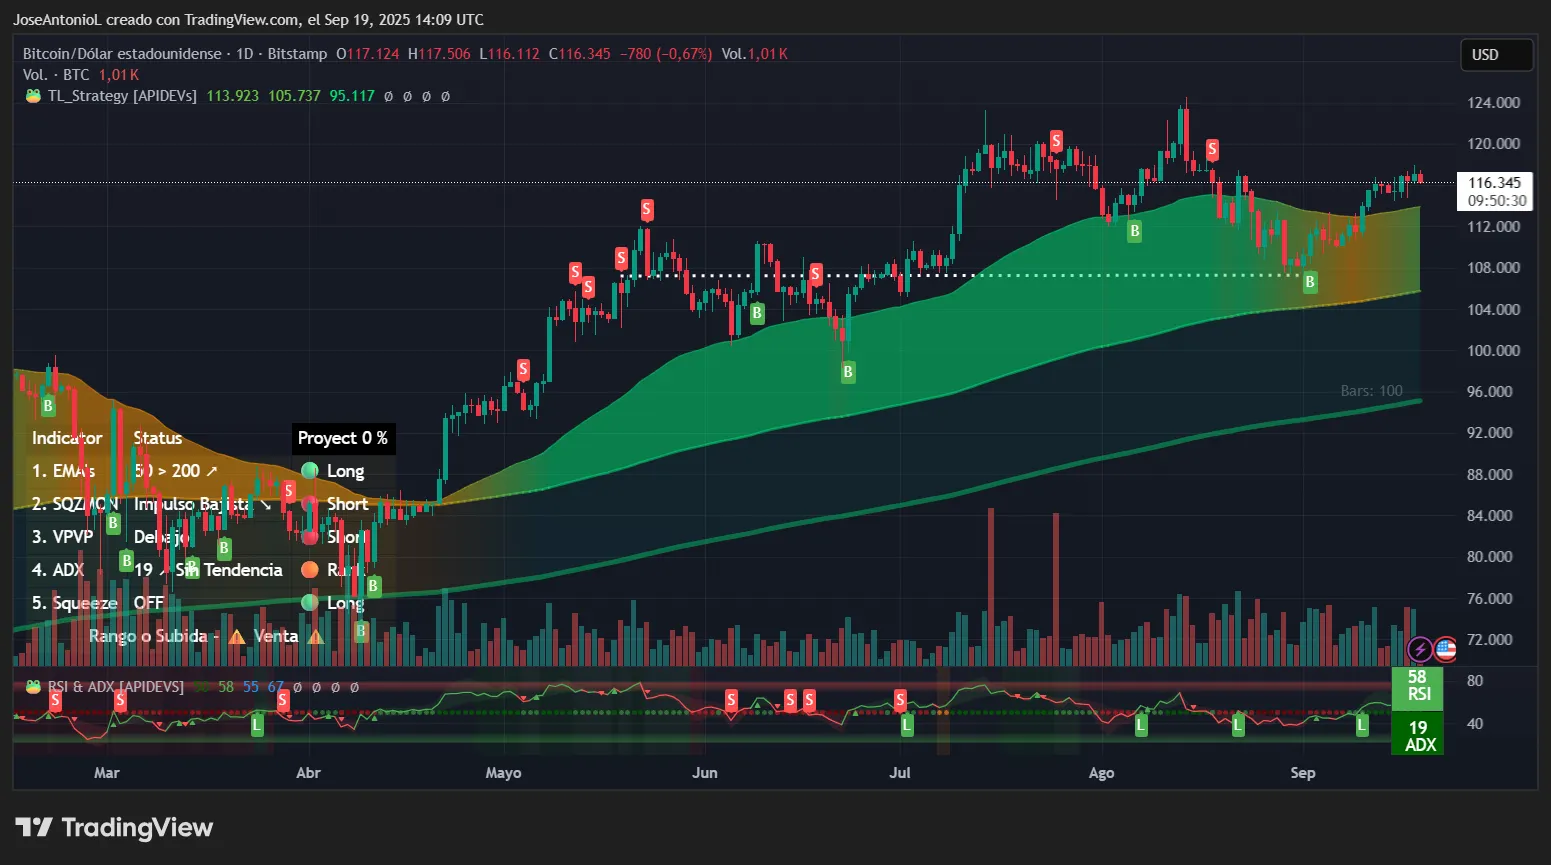
Bitcoin is trading NEAR the $116K-$117K zone, down about 1% over the past 24 hours. Looking at the daily chart, BTC opened at $117,124 and reached a high of $117,500—testing but failing to break above the round $118,000 resistance level. The lowest point touched $116,112, showing that the price has been pushing upwards almost through the entire day.
The technical indicators still paint a picture of a market in consolidation mode, despite the slow but bullish action maintained throughout the first half of the month. The Relative Strength Index sits at 58, indicating moderate bullish momentum – this level suggests buying pressure remains healthy without being overextended. When RSI reads between 50-70, traders typically view this as sustainable upward momentum that could continue without immediate profit-taking pressure.
The Average Directional Index measures trend strength on a scale of 0-100, where readings below 20 indicate no clear trend and above 25 confirm a strong directional move. At 19, Bitcoin is basically in accumulation mode—the market is consolidating without a strong directional bias. This often precedes significant moves as the market builds energy for the next leg.
The configuration of the moving averages shows bitcoin trading well above both its 50-day and 200-day exponential moving averages, which the chart indicates are in a bullish stack formation. This means short-term momentum remains positive, and the uptrend structure from the summer rally remains intact. Traders typically see this as a sign that any pullbacks should find support at these moving average levels.
The Squeeze Momentum Indicator shows "off" status, suggesting volatility has already been released and the market is in a quieter phase. This aligns with the narrow trading range and could indicate that Bitcoin is coiling for its next major move.
Cardano: Building upside momentum
Cardano (ADA) is showing more positive price action, currently trading at $0.90, down 1.8% in the last 24 hours and canceling out yesterday’s gains. The daily candle shows ADA tested highs near $0.93 before pulling back slightly, with the low at $0.89.
In terms of overall trends, the price bounced effectively after approaching its EMA50 four days ago, showing a clear bullish trend in the long-term and almost canceling out losses from its August correction.
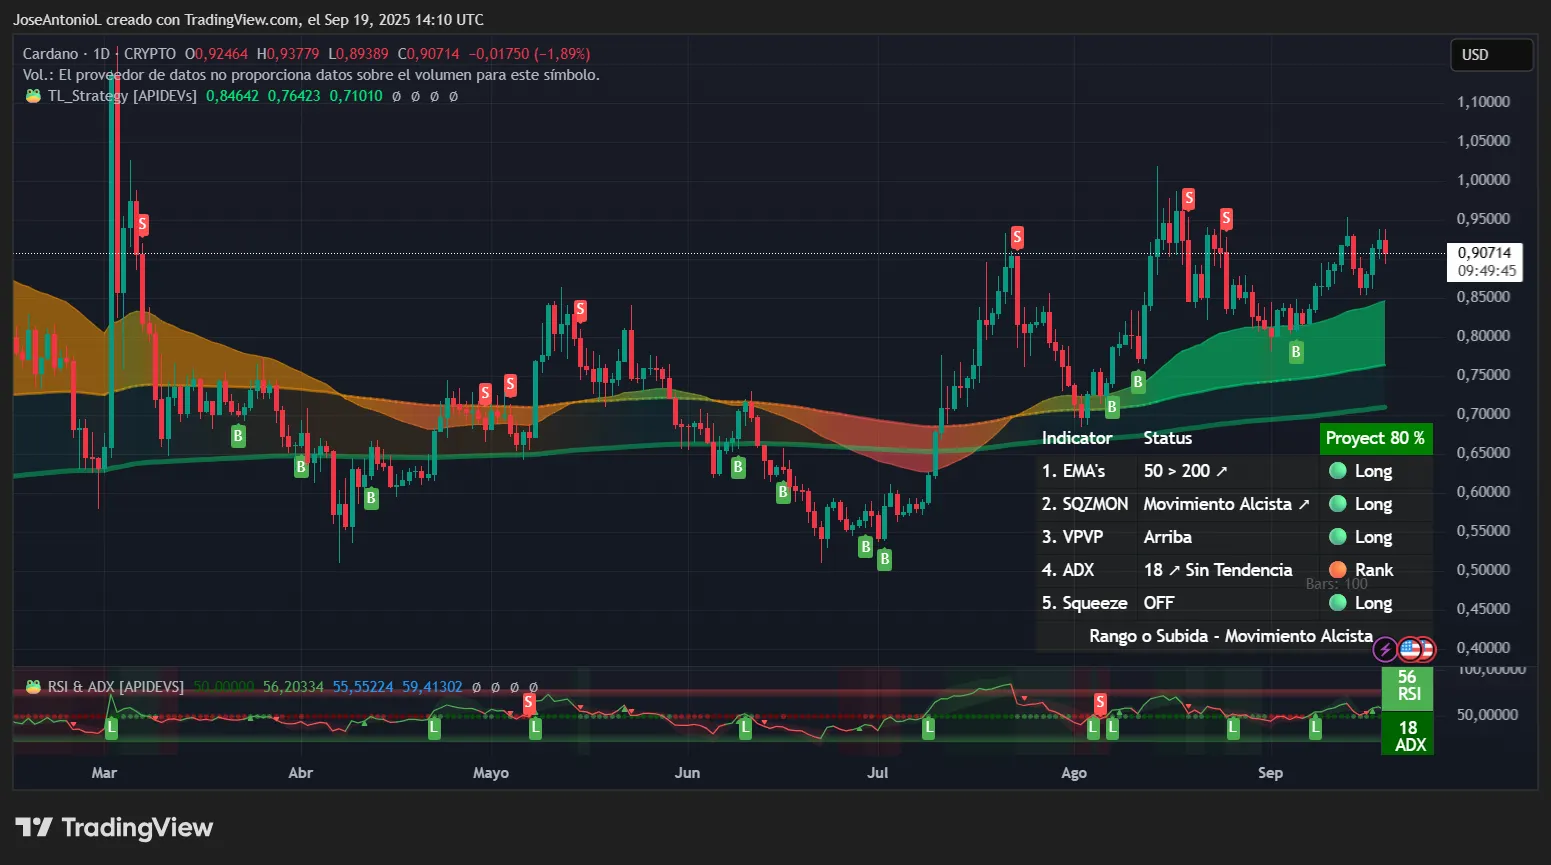
The RSI at 56 places Cardano in the bullish zone without being overbought. This "goldilocks" level—not too hot, not too cold—suggests ADA has room to run before hitting the 70+ levels where profit-taking typically accelerates. Traders often target entries when RSI sits between 50-65, as it indicates upward momentum without excessive speculation.
The ADX at 18, nearly similar to Bitcoin, shows cardano lacks a strong trending environment currently. However, given the positive price action and approaching the crucial 20-25 threshold, this could quickly change. When ADX crosses above 25 while price is rising, it often triggers momentum trading systems to add positions. It can be a good bet to place a long position expecting momentum to build up as the ADX increases.
The 50-200 EMA spread remains positive with both averages trending upward. The widening gap between these averages suggests increasing buying pressure across multiple timeframes, which typically supports sustained rallies.
NEAR Protocol: Oversold bounce potential
NEAR Protocol presents the most interesting technical setup, it pumped heavily yesterday reaching highs of $3.20, closing the day with a 12.6% upward movement. That movement continued for a while in today’s session, reaching a high of $3.34—but bulls failed to keep up momentum, and the coin corrected to its current price of $3.15 for a -0.67% intraday loss.
The significant intraday spike was abnormal, so a correction was expected. However, if the price does not fall back below the EMA50 soon, then the possibilities of a golden cross increase dramatically.
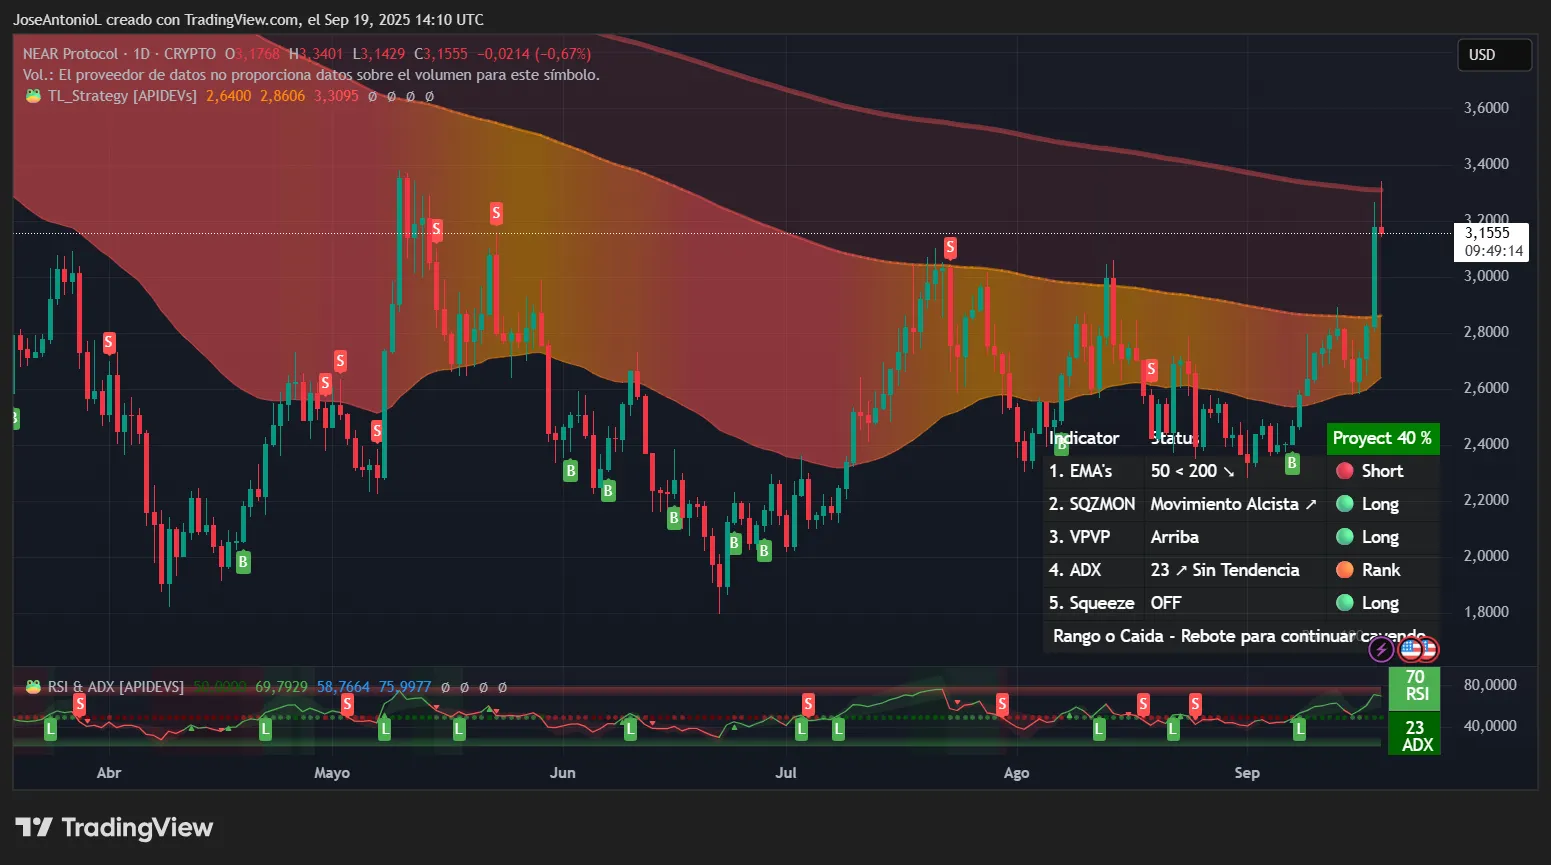
The RSI at 70 has entered overbought territory, which might seem bearish at first glance. However, when RSI pushes above this level after an extended downtrend, it often signals the start of a new impulse wave rather than an immediate reversal. In periods of price recovery, overbought can stay overbought for a while, especially when breaking out of oversold conditions.
The ADX at 23 is approaching the critical 25 threshold where trends become confirmed. This rising ADX during a price recovery suggests the recent downtrend is losing steam and a reversal may be underway. Traders typically watch for ADX to cross 25 while the price holds above key moving averages as confirmation of trend change.
The EMA structure shows NEAR trying to enter into a golden cross formation, with the 500-day EMA level breaking past the 200-day EMA mark. Sustained trading above the 50-day EMA WOULD signal a return to bullish market structure, while rejection here could lead to another leg down.
Disclaimer
The views and opinions expressed by the author are for informational purposes only and do not constitute financial, investment, or other advice.
