XRP Outpaces Dogecoin While Ethereum Lags: A Crypto Power Shift in 2025

XRP isn't just leading—it's lapping the competition. While Dogecoin scrambles to keep up and Ethereum gasps in the distance, Ripple's darling is rewriting the rules of the race.
Here's why the underdog narrative is dead.
Dogecoin's meme magic fades as XRP's utility-first approach dominates real-world adoption. Meanwhile, Ethereum's 'ultrasound money' rebrand can't hide its congestion woes—gas fees still bite when you least expect it.
The kicker? Institutional money's voting with its wallet. While crypto bros argue over maximalism, hedge funds are building positions in assets that actually settle cross-border payments. (Take that, diamond-handed BTC hodlers.)
One trader's 'safe bet' is another's relic. The 2025 crypto landscape rewards speed over hype—and right now, XRP's eating everyone's lunch.
XRP price: New all-time high, now what?
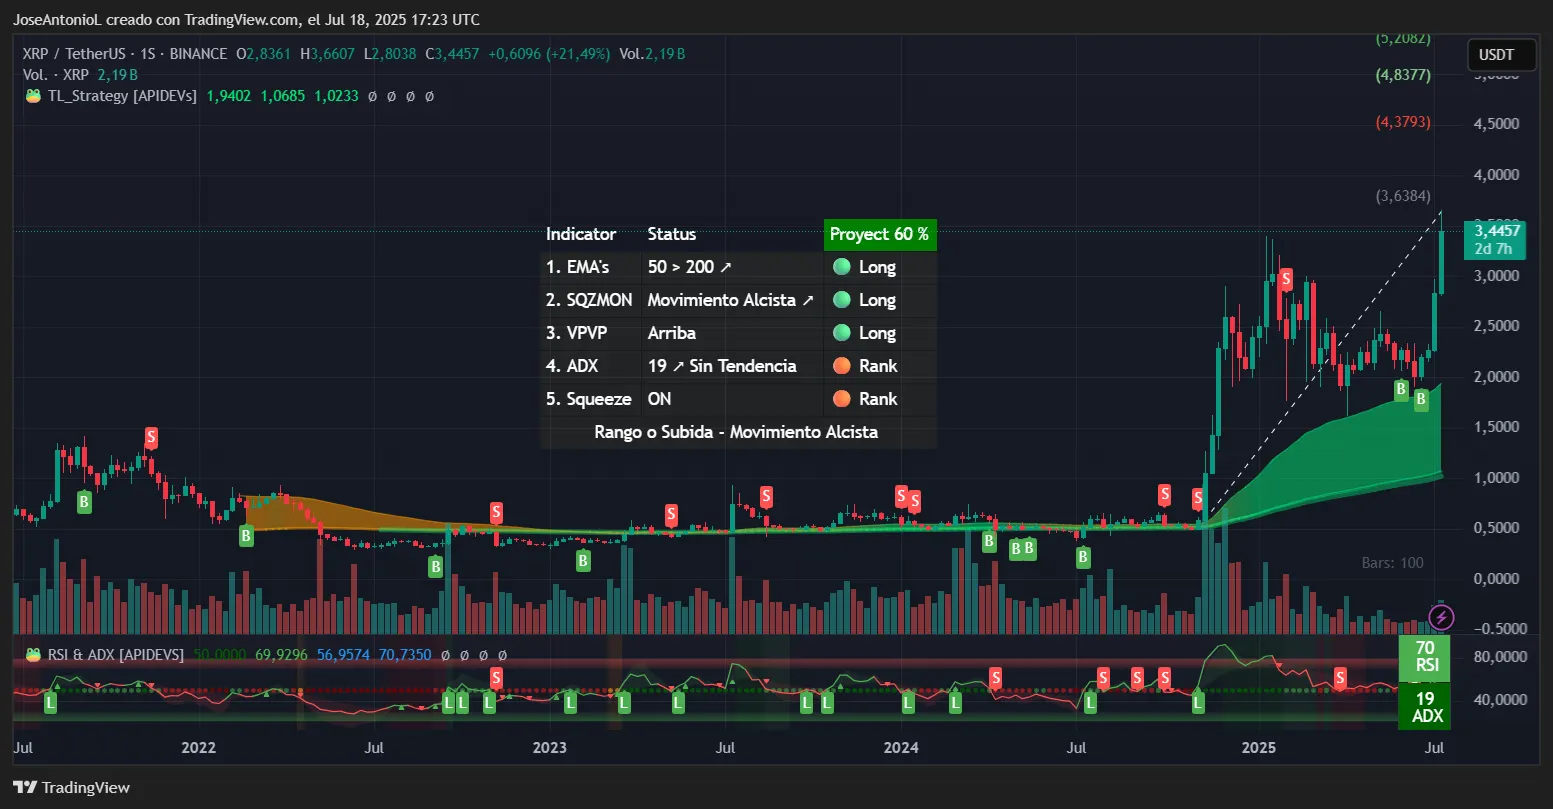
XRP has finally done what must’ve felt like impossible for some holders over the last seven years. It at last broke above its 2018 all-time high of $3.40 to reach $3.66. Looking at the weekly chart, which filters out daily noise and provides a clearer picture for multi-month holding strategies, XRP's technical structure seems to be strong enough to signal continuation.
The weekly Relative Strength Index, or RSI, at 70 sits precisely at the overbought threshold—a level that typically signals caution for day traders but tells a different story on longer timeframes. When viewing weekly charts, RSI readings above 70 often mark the beginning of sustained bull runs rather than immediate reversals. Historical analysis shows that assets can remain "overbought" for a few weeks during strong trends, making this a bullish signal for patient holders.
The Average Directional Index, or ADX, stands at 19 for XRP on the weekly timeframe. But that might be deceiving. ADX measures trend strength, regardless of direction, from a scale of 0 to 100. And while readings below 25 typically indicate weak trends, the context here matters. On weekly charts during breakouts from multi-year ranges, low ADX often signals that the real trend hasn't started. In this case, considering XRP has been trading sideways for years without any major movement, such a low ADX is to be expected.
The moving average configuration on the weekly chart provides the most bullish signal. The 50-week EMA (essentially the one-year average price) sits well below current levels, while the gap to the 200-week EMA continues to expand. This widening differential on weekly timeframes typically precedes multi-month trending moves, as it reflects sustained accumulation over shorter-term profit-taking.
The Fibonacci extensions (theoretical resistances that can be projected during price discovery periods) drawn on the chart suggest theoretical resistance levels at $4.3 and beyond if the current all-time high is not really a new price testing zone—though in true price discovery, these serve more as psychological milestones than hard barriers.
Dogecoin price: Lots of bark, wen bite?
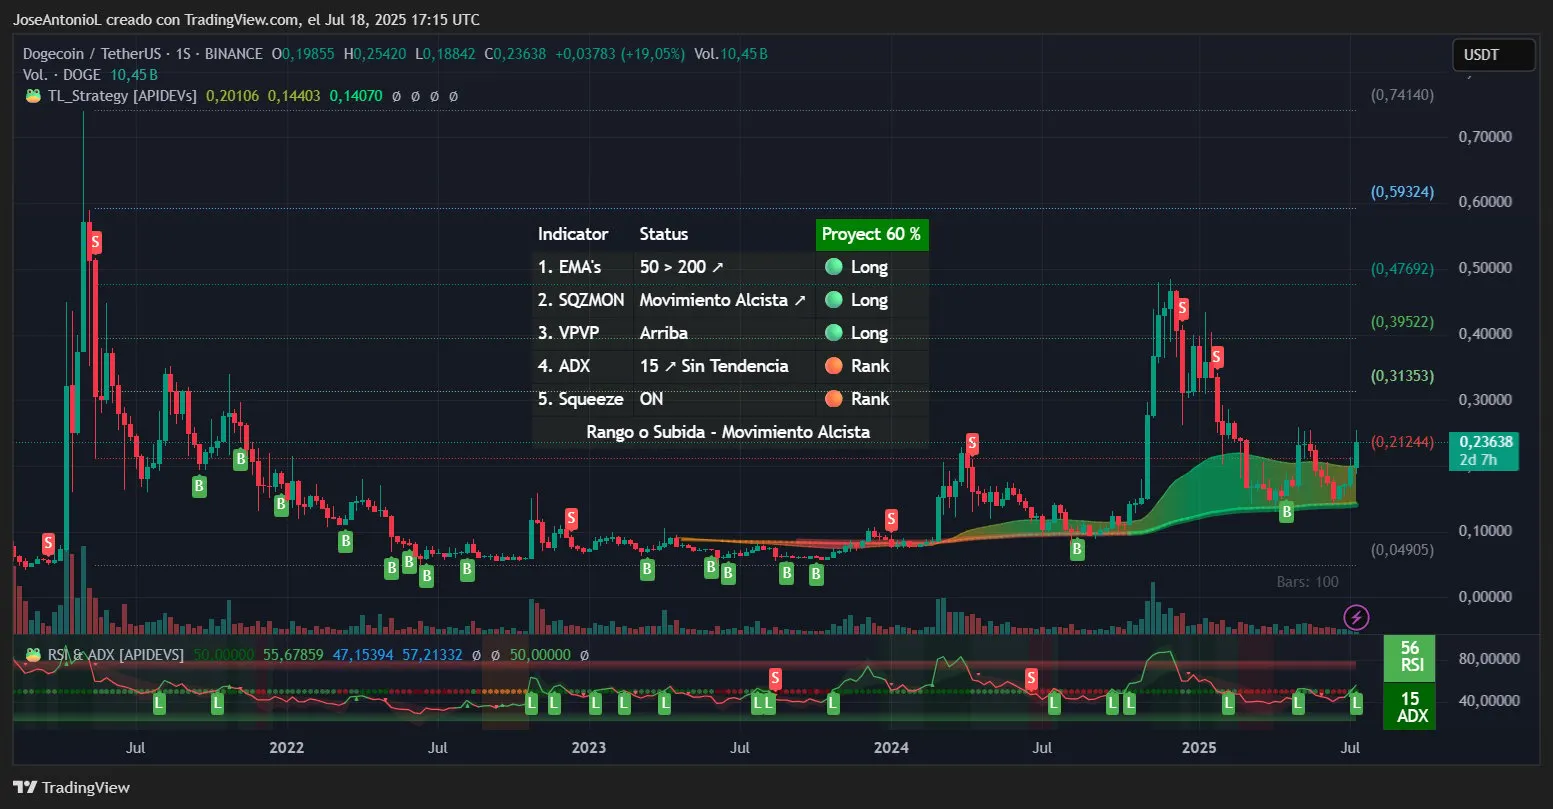
Dogecoin's weekly chart reveals a cryptocurrency at a critical inflection point, trading at $0.20 after a significant rally from its 2024 lows. In the weekly charts, Doge seems to be building a base that could support a multi-month move in either direction as it tests an important resistance.
The weekly RSI at 56 places DOGE practically in perfectly neutral territory. Unlike daily RSI, which can whipsaw between extremes, weekly RSI at 56 suggests the market has fully digested recent gains and awaits the next catalyst. For position traders, this presents an opportunity to accumulate before the next trend emerges, with a risk-to-returns ratio still manageable, at least for crypto standards (30% down vs 90% up).
The ADX at 15 on the weekly chart confirms what the price action suggests—a market in consolidation. When weekly ADX drops below 20, it typically indicates a multi-week to multi-month accumulation phase. These periods of "no trend" on weekly charts often precede the most explosive moves, as they represent maximum uncertainty and therefore maximum opportunity when direction finally emerges.
Dogecoin's position relative to its weekly moving averages offers crucial context. Trading above the 50-week EMA maintains the longer-term uptrend structure, but the convergence of the 50 and 200-week EMAs (the gap between both EMAs is starting to get shorter) suggests the market is not so sure about DOGE’s potential to keep up bullish momentum for a long time.
Ethereum price: Bulls and bears battle it out
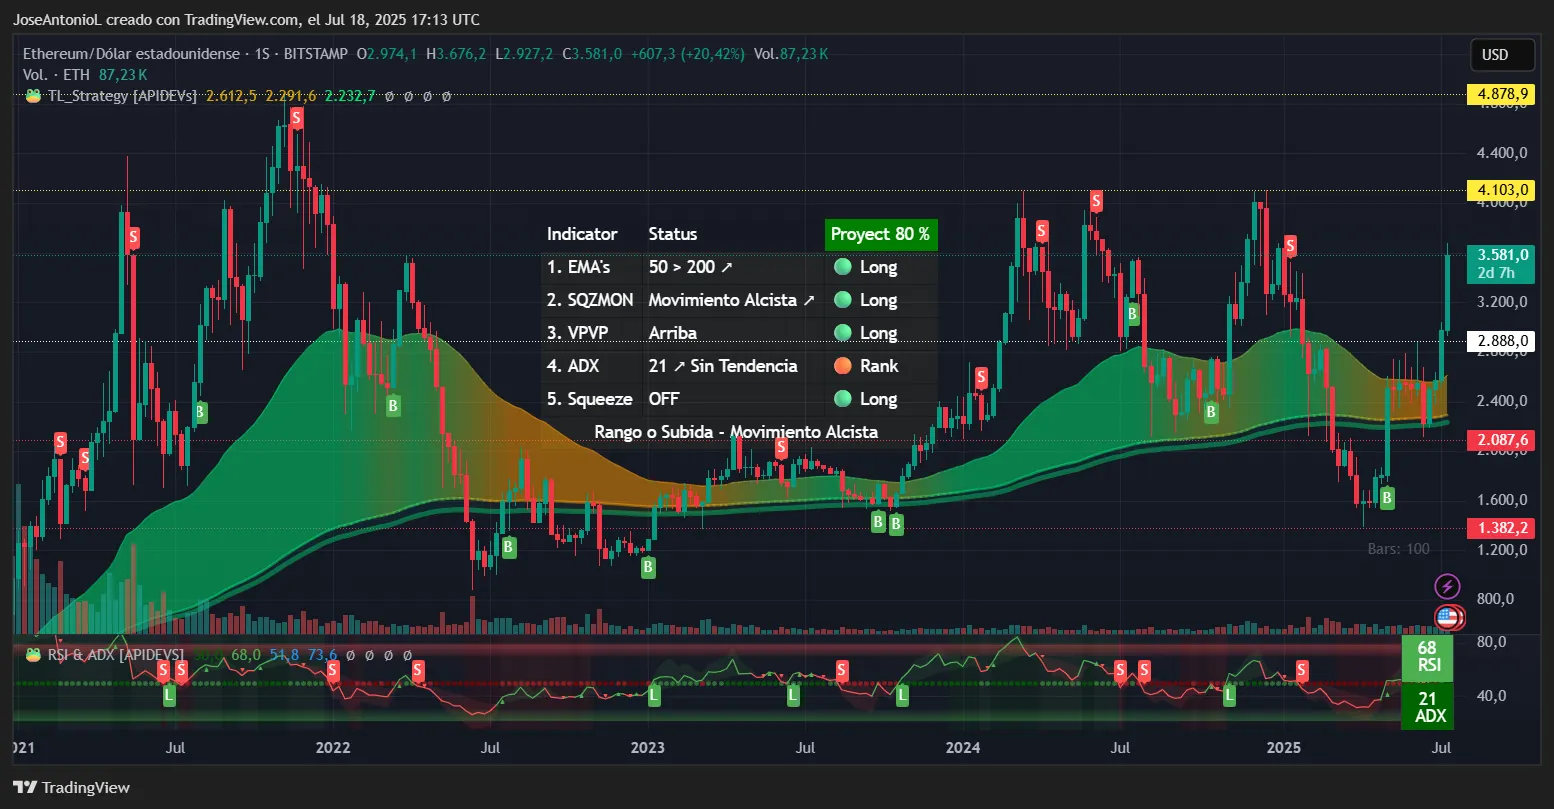
Ethereum's weekly chart presents a more nuanced picture than the daily gyrations might suggest. Currently trading at $3,581, ETH faces a clear battle between long-term bullish structure and medium-term resistance levels that have capped rallies throughout 2024 and early 2025.
The weekly RSI at 68 approaches but hasn't breached the 70 overbought level, suggesting room for continuation if buyers step up. On weekly timeframes, RSI between 60-70 often marks the "sweet spot" for sustained trends—strong enough to indicate genuine momentum but not so extended as to invite immediate profit-taking. This positioning favors patient bulls over the coming months.
The ADX at 21 on the weekly chart just crosses the threshold confirming trend existence. While not a powerful reading, crossing above 20 on weekly timeframes often marks the transition from consolidation to trending phases. For position traders, this suggests ETH may be in the early stages of its next major move, though conviction remains to be proven.
Looking at the charts, ETH has failed to break past $4,000 when tested. So, for ETH traders, there may be some gain yet before taking profits again as they wait for markets to decide if the bullish trend will continue.
The yellow resistance zones clearly marked at $2,888 and $3,580 are the key battlegrounds on the weekly chart, representing areas where significant distribution occurred previously, creating overhead supply that must be absorbed. The red support lines at $2,087 and $1,382 mark the foundations of the current structure.
The weekly EMA configuration remains constructive, with price above both the 50 and 200-week averages. However, the relatively narrow gap between these averages compared to 2021's bull run suggests the market hasn't fully committed to a new major uptrend. This sets up 2025 as a potential breakout year if these resistance levels can be cleared.
Over on Myriad, a prediction market developed by Decrypt's parent company Dastan, users currently place the odds of new ethereum all-time high this year at 54%. So, bullish—but not decidedly so.
Disclaimer
The views and opinions expressed by the author are for informational purposes only and do not constitute financial, investment, or other advice.
