Meme Coin Bloodbath: Time to Buy the Dip or Run for the Hills?

Crypto''s joke assets just got punched in the face—hard. Meme coins are bleeding out after a brutal market correction, leaving degenerates wondering: Is this the ultimate buying opportunity or the first sign of the apocalypse?
The Great Meme Purge of 2025
Dog-themed tokens and celebrity cash-grabs tanked 40-60% overnight as Bitcoin dominance surged. Retail investors who FOMO''d in at ATHs are now learning the oldest lesson in finance: what goes up must come down—especially when it''s built on vibes and Elon tweets.
Diamond Hands vs. Exit Liquidity
Crypto Twitter splits into two camps: The ''buy the dip'' brigade pointing to historical rebounds, and skeptics noting meme coins'' 90%+ crash rates post-hype. Meanwhile, institutional traders quietly rotate into ETH ETFs—because nothing says ''mature market'' like gambling with slightly better paperwork.
Closing Thought: Maybe the real meme was the friends we liquidated along the way.
Pepe faces whale-driven distribution
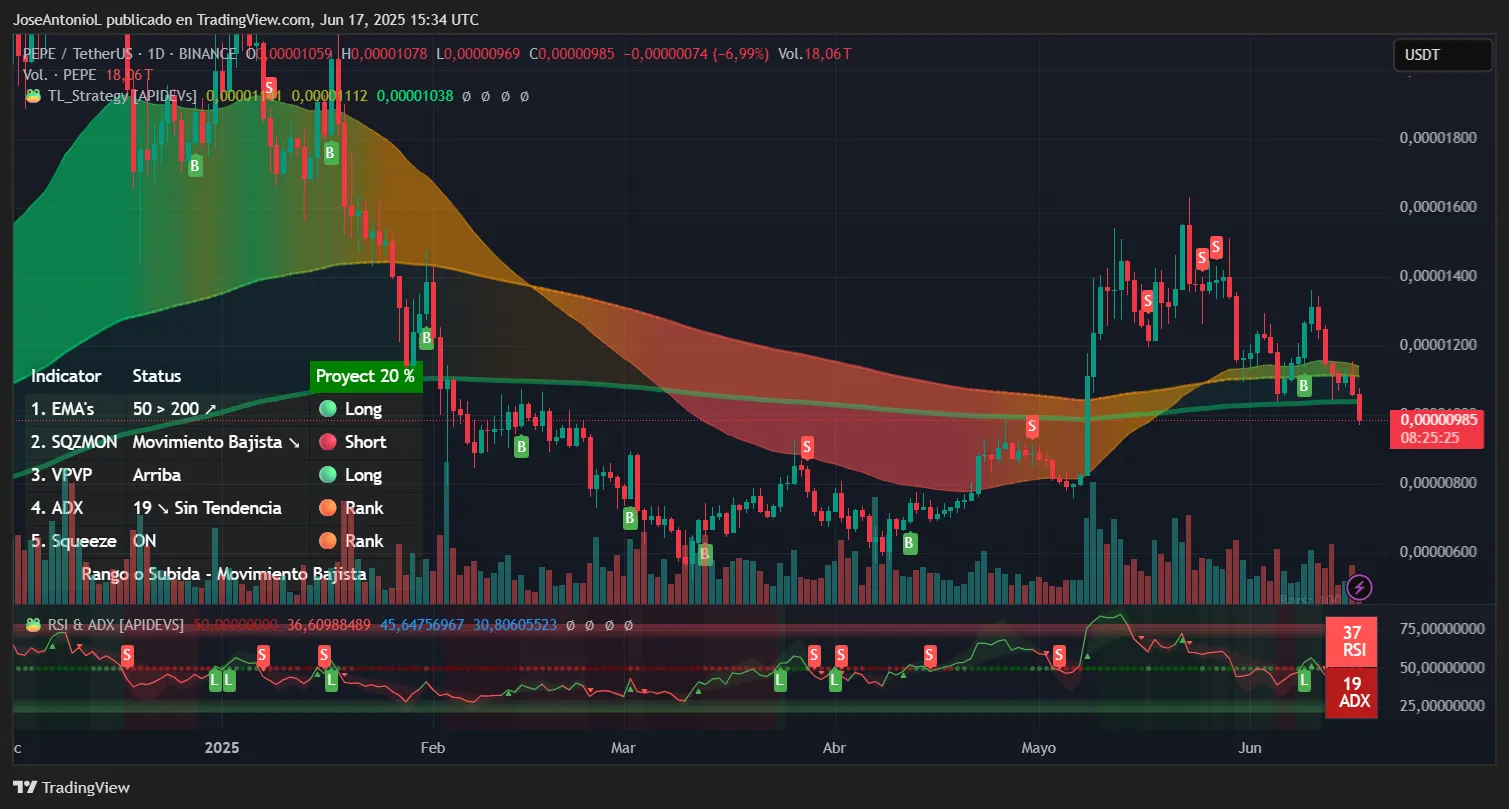
Pepe’''s 12% daily decline reflects a confluence of bearish factors that suggest more pain ahead. The technical picture on the weekly chart shows clear distribution patterns: With the price trading a little bit below $0.000010, the coin has broken below critical support levels.
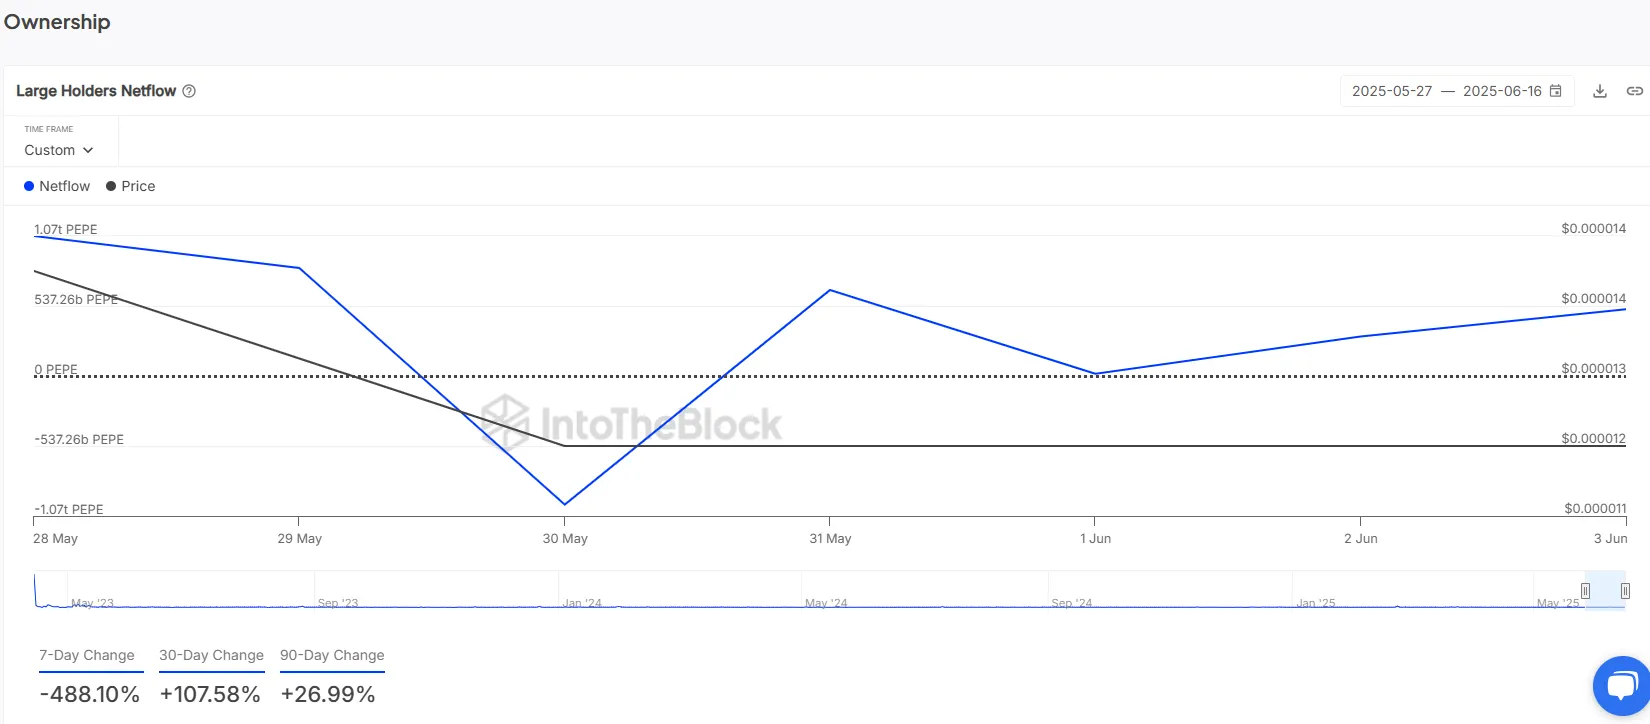
On-chain data showing whale netflows spiked on June 16, signaling distribution and selling pressure. When whales—defined in this case as addresses controlling over 1% of the supply—begin moving tokens to exchanges, it typically precedes significant price declines. There’s little reason to MOVE meme coins to centralized exchanges unless it’s to dump your bags.
Technical indicators paint an equally bearish picture. The Relative Strength Index, or RSI, which measures whether an asset is overbought or oversold, sits at 40.5 on the weekly timeframe, indicating weakening momentum without reaching oversold conditions that might trigger a bounce. The Average Directional Index, or ADX, at 26 shows a trending bearish market gaining strength. ADX measures trend strength regardless of direction.
Key support levels to watch include the $0.0000104 Fibonacci swing low—a break below this level could trigger cascading liquidations and extend losses toward $0.0000085. The 50-day EMA (average price over the last 50 days) at approximately $0.0000118 now acts as resistance, making any recovery attempts likely to face selling pressure.
SPX6900 tests its bullishness
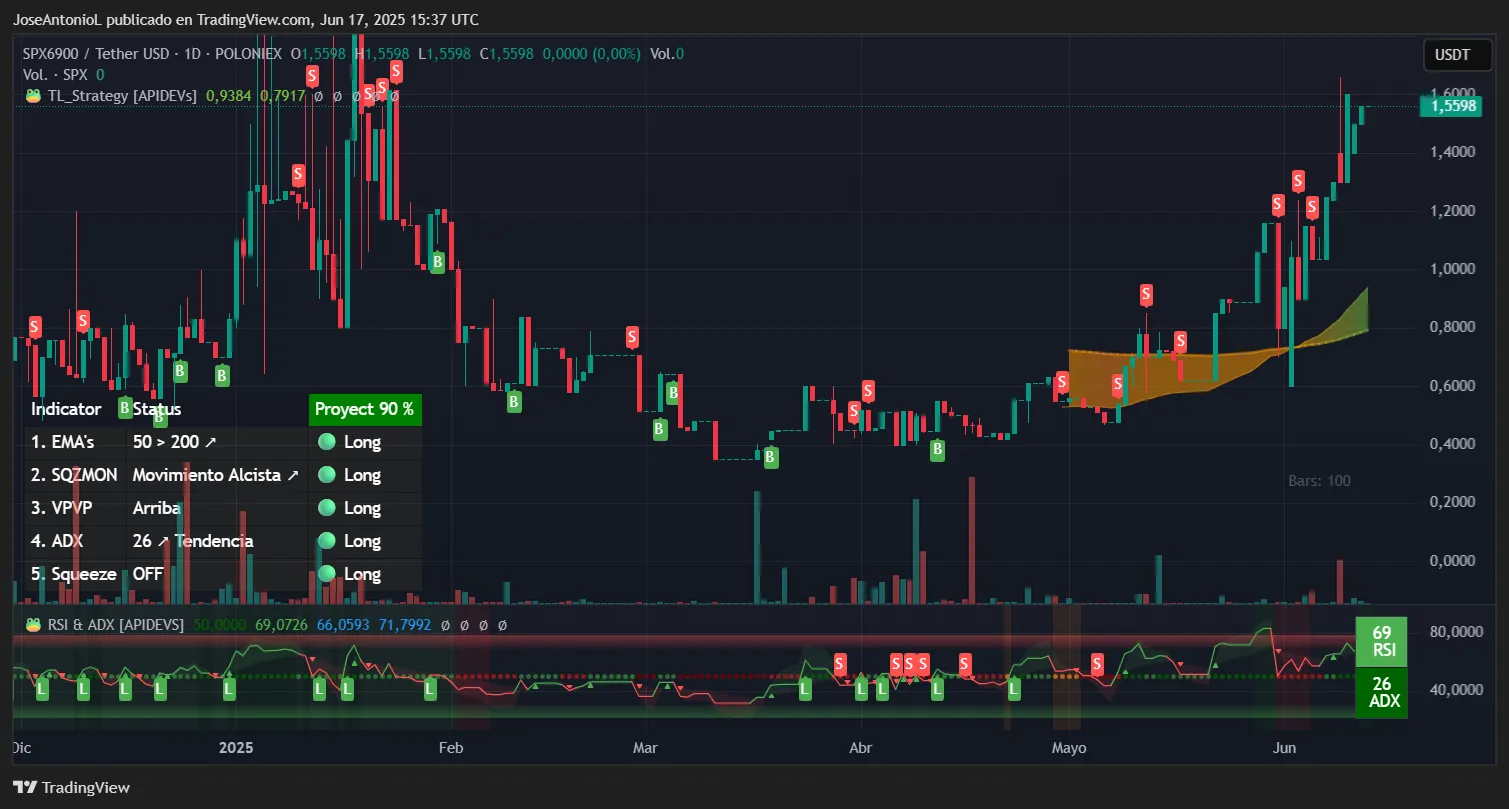
SPX6900''s 11.55% drop comes after an extraordinary run that saw the token gain 230% between May and June. Currently trading at $1.50, the meme coin that mockingly positions itself as the S&P 500 of crypto is experiencing a classic case of profit-taking after reaching unsustainable heights.
What comes up, always comes down.
The weekly chart reveals SPX6900 consolidating within a large symmetrical triangle pattern, with the current week''s candle threatening to break below the lower trendline. The RSI has cooled from overbought levels above 75 to 69 (no meme), while the ADX at 26 suggests the previous strong trend is losing momentum but is still in play.
Critical support sits at $1.30. A weekly close below this level WOULD confirm the triangle breakdown and could accelerate selling toward $1.08, where the short term EMA provides potential support. The next resistance can be set at around $1.80 if the bullish trend remains solid.
Fartcoin meets market reality
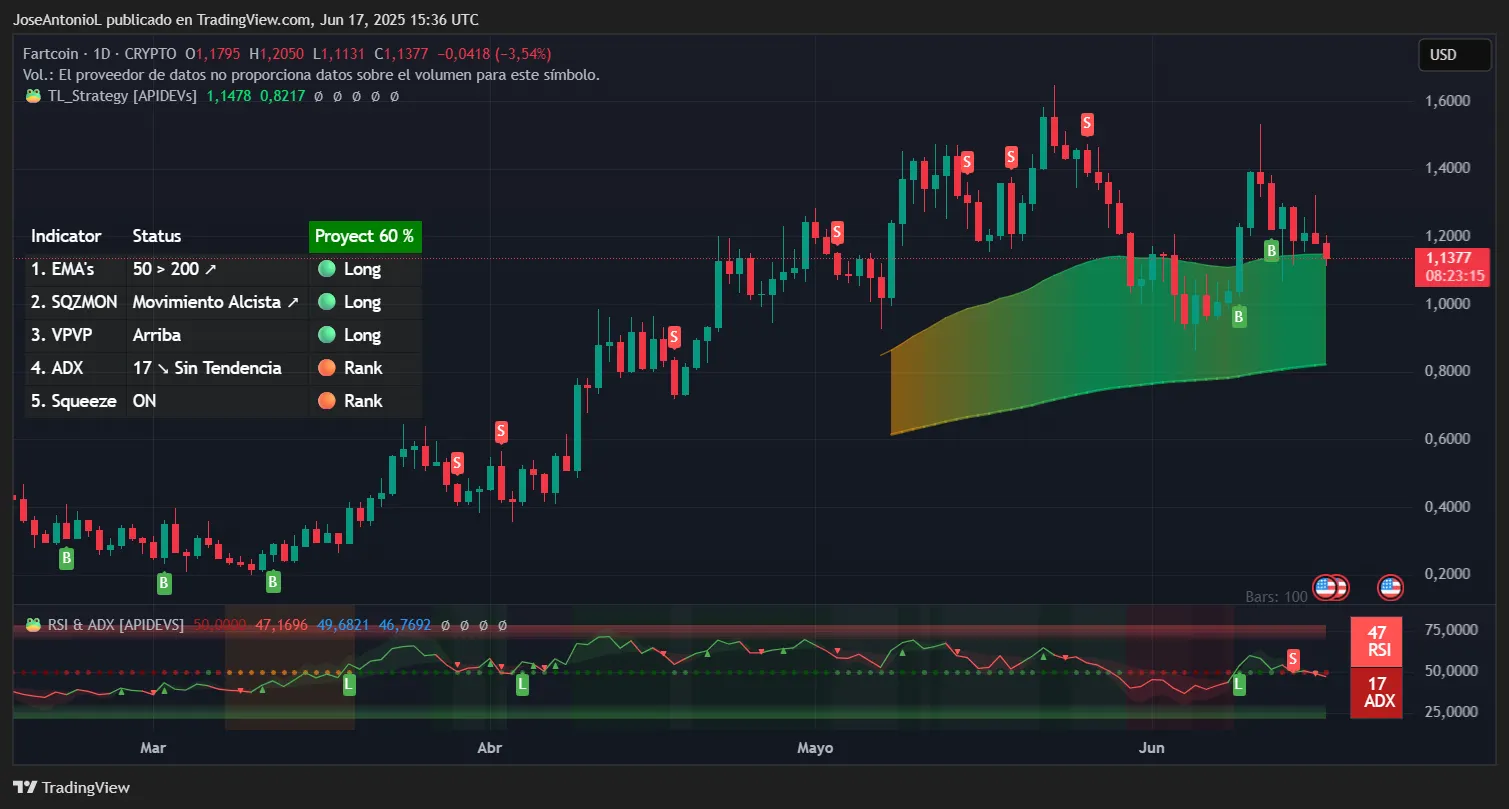
Fartcoin''s 8.99% decline might seem modest compared to its peers, and just a normal day in the life of a degen, but the technical setup suggests this Solana-based meme coin faces significant headwinds. Trading at $1.13, the token is struggling to maintain momentum after its parabolic rise.
The daily chart shows FARTCOIN trapped within a small short descending channel, with the current week''s candle about to test the lower boundary. A broader view shows that even though things look bullish, the token’s last high on June 25 at $1.50 was not able to match May''s high mark of $1.60. This could signal that bulls can push for a recovery after a bearish correction, but not enough to sustain the pace it had weeks ago
The ADX reading of 17 indicates a lack of directional strength, suggesting the token is caught in a consolidation phase that could resolve in either direction. However, with the RSI at 37 on the weekly timeframe and 47 on the daily, it appears traders are potentially bearish, trying to sell their coins quickly.
Buy the dip or run for the hills?
The technical evidence across all three major meme coins suggests this correction has further room to run (and in a bad way). The combination of whale distribution in Pepe, derivatives unwinding in SPX6900, and technical breakdowns in Fartcoin paints a picture of a sector experiencing a necessary but painful reset after unsustainable gains.
However, for contrarian investors with strong risk tolerance, these levels might represent accumulation opportunities. History shows that panic selling rarely leads to smart decisions, and markets usually transfer money from the impatient to the patient. But it’s not as if we’re recommending patience (or recommending anything at all, really) with meme coins, which are famous for their short life spans.
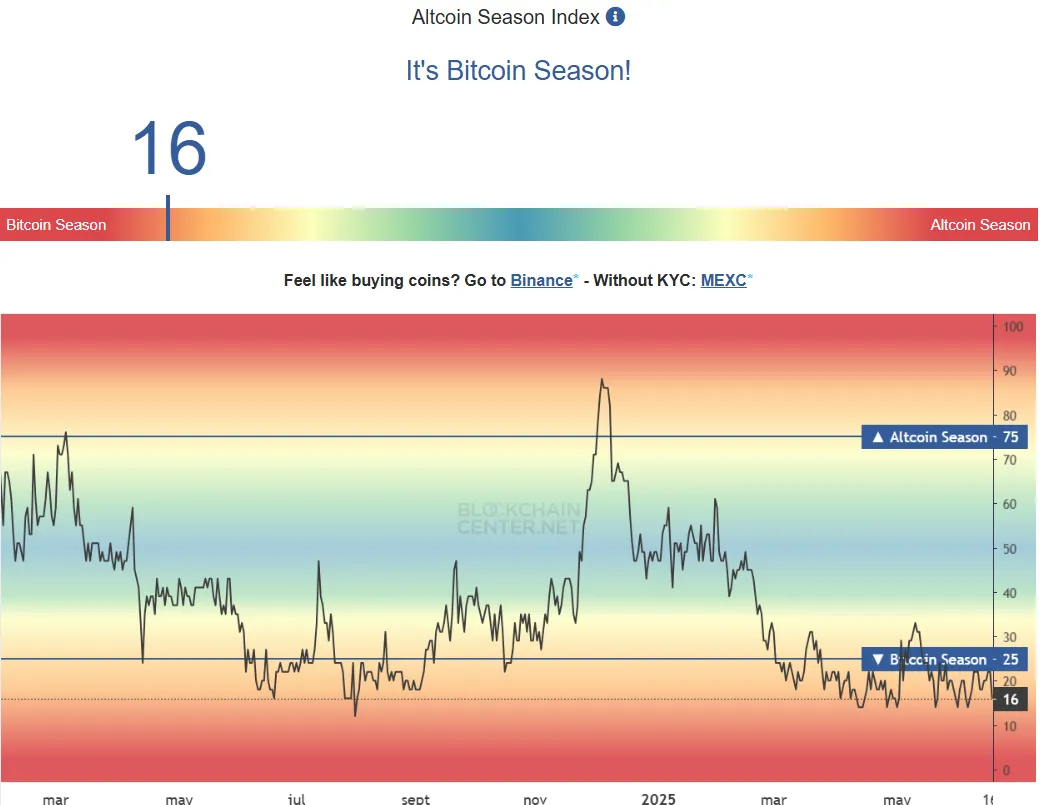
The key differentiator will be Bitcoin''s trajectory and the resolution of current geopolitical tensions. If Bitcoin can hold above $100,000 and Middle East tensions ease, meme coins could see a relief rally—mimicking BTC, but with more volatility. But with Bitcoin dominance rising, and the Altcoin Season Index at extreme lows, the path of least resistance appears to be going lower for these speculative tokens.
For traders considering entries, waiting for clear support holds and momentum shifts would be prudent. Pepe needs to reclaim $0.0000118, SPX6900 must defend $1.30, and Fartcoin requires a move above $1.28 to signal potential bottoms. Until then, the meme coin massacre may have a few more casualties to claim.
Disclaimer
The views and opinions expressed by the author are for informational purposes only and do not constitute financial, investment, or other advice.
