Ondo Price Surges Past Breakout Zone as Tokenized RWA Market Explodes Past $29B Milestone

Ondo's token just smashed through critical resistance levels—riding the massive wave of institutional money flooding into real-world asset tokenization.
The $29 Billion Reality Check
That staggering market cap figure isn't just a number—it's Wall Street finally admitting blockchain might actually be useful for something beyond speculative gambling. Traditional finance giants are scrambling to tokenize everything from treasury bonds to real estate, and Ondo's positioned right at the center of the action.
Breakout momentum suggests traders are betting big on RWA protocols becoming the next infrastructure play—while legacy finance still tries to figure out whether to regulate or replicate.
Watch those key levels hold—because nothing makes bankers more nervous than watching decentralized alternatives actually start working.
RWA market boom lifts Ondo
The rally coincided with a wider surge in tokenized assets. The market capitalization of RWA tokens ROSE from about $67 billion to nearly $76 billion over the past week, setting a new high. Meanwhile, the total value of tokenized assets on-chain surpassed $29 billion for the first time, based on data from RWA.xyz.
Ondo has been at the center of this momentum. Together with Ondo, Trust Wallet introduced tokenized U.S. stocks and exchange-traded funds on Sept. 9. The integration enables users globally to trade stocks like Apple and Tesla onchain without the need for brokers, with the help of the decentralized exchange aggregator 1inch (1INCH).
Ondo’s protocol total value locked has also expanded significantly this year, rising from $650 million in January to $1.56 billion as of Sept. 12, according to DefiLlama data.
Ondo price technical analysis
The ONDO/USDT daily chart shows the token pressing against the upper Bollinger Band NEAR $1.13, supported by rising volume. A relative strength index of 66 suggests building momentum but not yet overbought conditions.
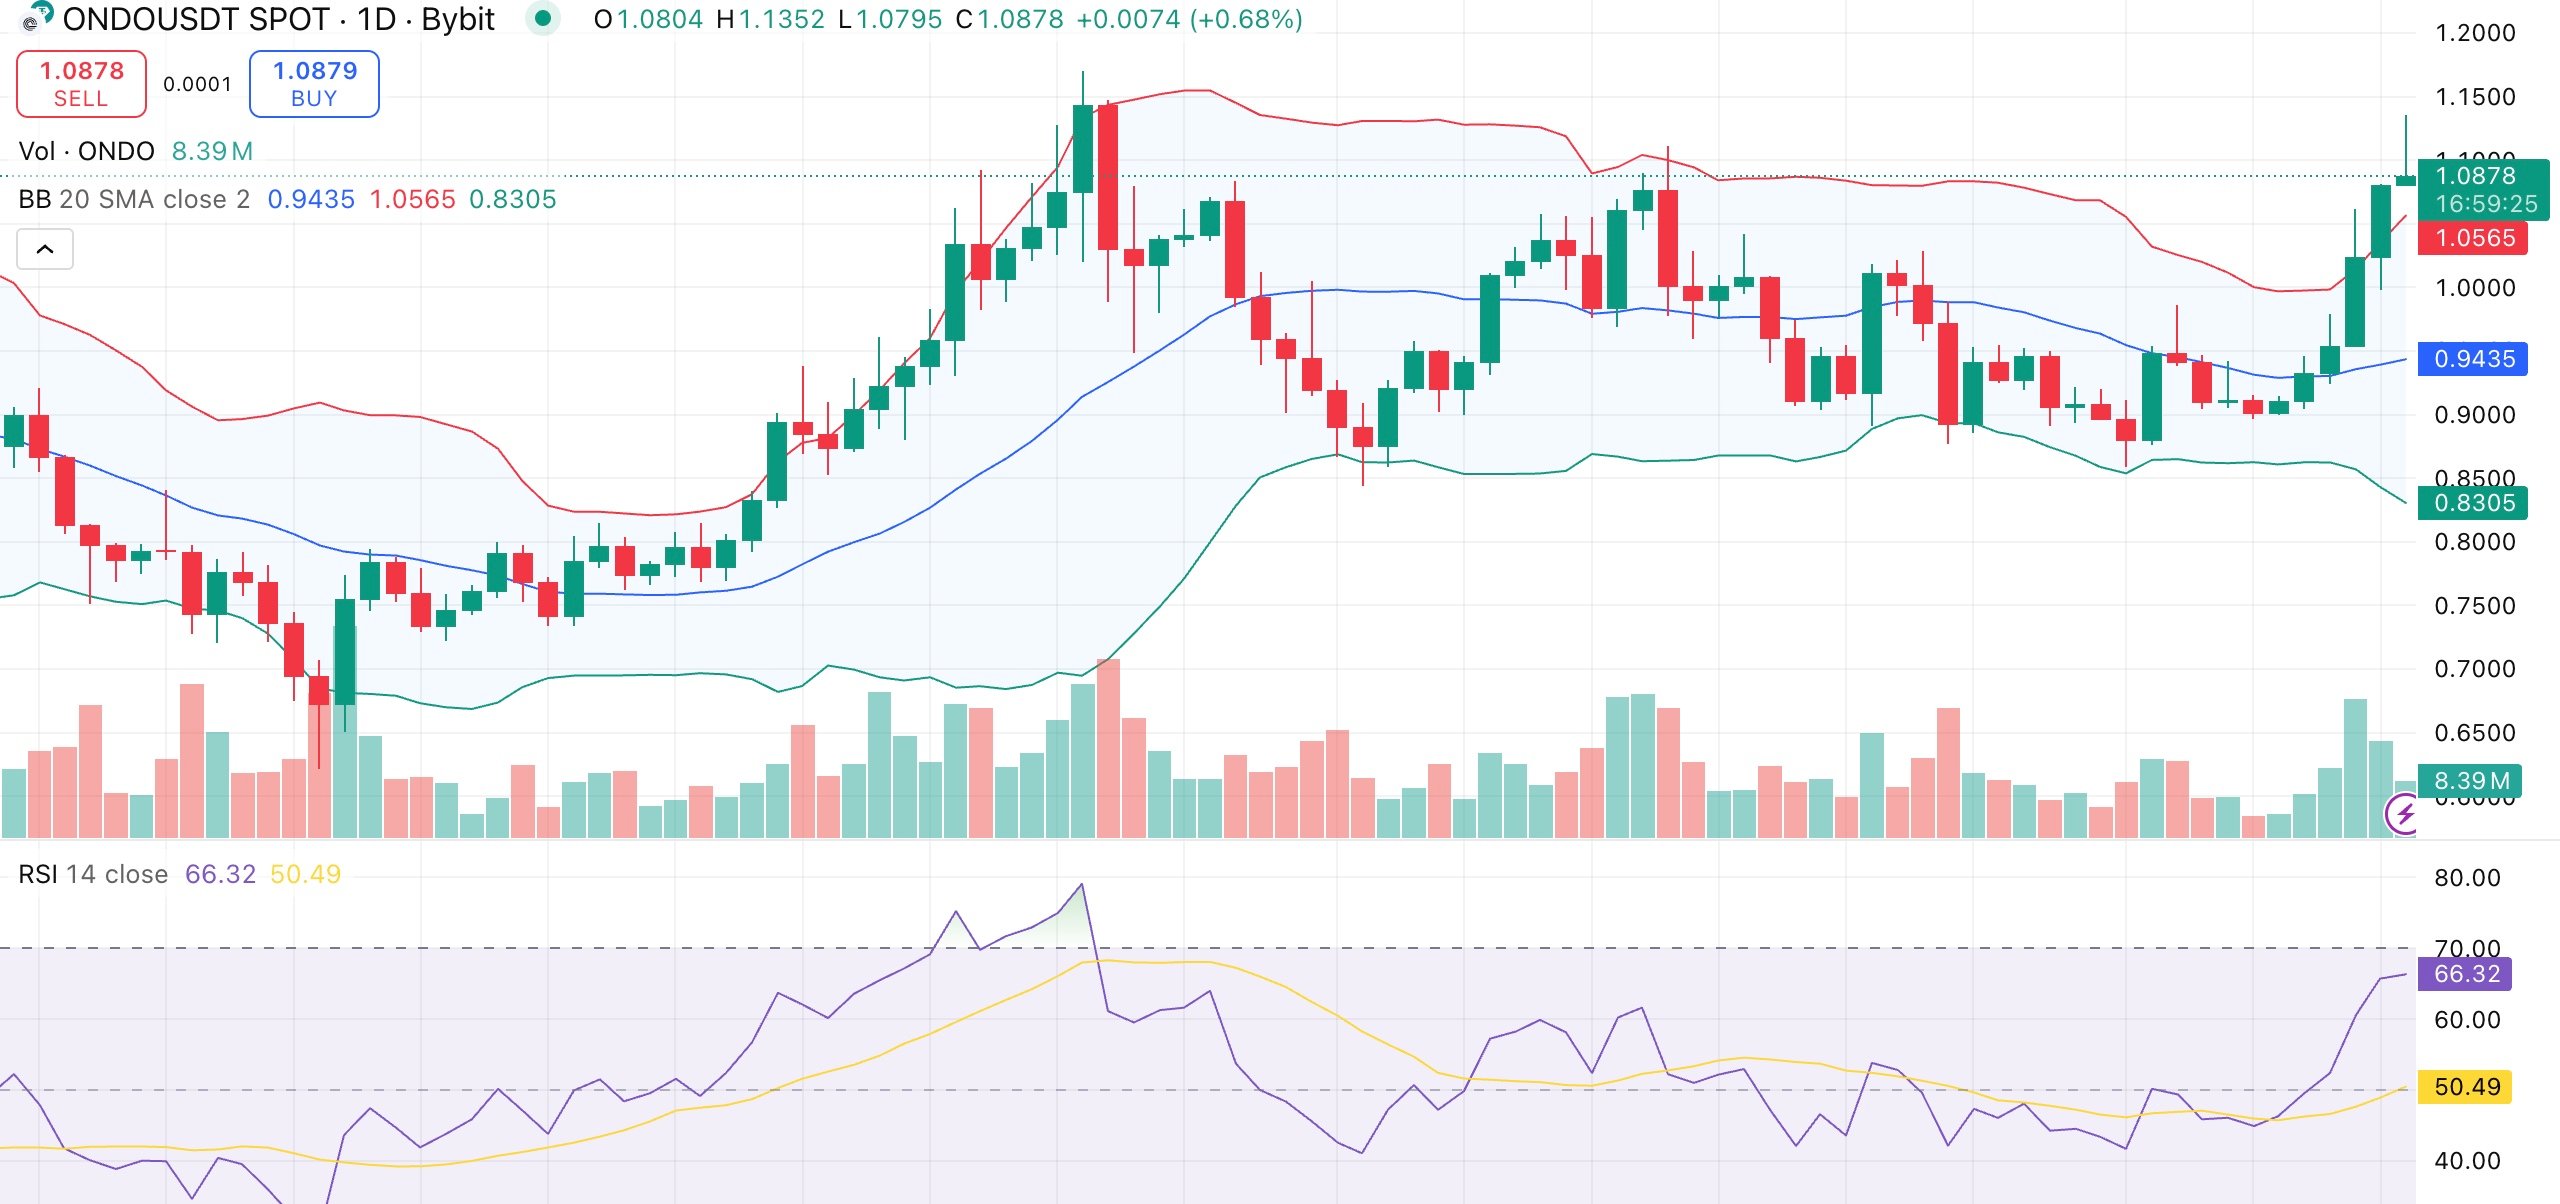
The majority of moving averages, ranging from the 200-day SMA to the 10-day EMA, show bullish alignment, offering a constructive backdrop.
MACD readings display a buy signal, but momentum has slowed, suggesting potential short-term consolidation. If the $1.13 resistance is decisively broken, it may set up a MOVE toward $1.20 and beyond, while failure to hold above $1.00 risks a retracement toward $0.95, where both moving averages and the middle Bollinger Band provide support.
