Kaspa Price Primed for Rebound: 3 Key Reasons the Monthly Downtrend Could Reverse Soon
Kaspa breaks its bearish streak as market dynamics shift in favor of the altcoin.
Technical Breakout Signals Strength
Kaspa's chart patterns suggest a classic reversal setup—oversold conditions meeting strong support levels. Trading volume spikes hint at accumulating interest while key resistance levels show early signs of cracking under buying pressure.
Ecosystem Developments Fuel Momentum
Recent network upgrades and growing developer activity create fundamental tailwinds. The project continues delivering on its roadmap while competitors struggle with execution—because in crypto, actually shipping features remains surprisingly rare.
Market Cycle Alignment
Broader altcoin season patterns indicate rotation into undervalued assets with strong technological foundations. Kaspa's proof-of-work architecture gains renewed attention as investors seek projects with actual infrastructure rather than vaporware promises.
While traditional finance still dismisses crypto as speculative gambling, Kaspa's technical merits and growing adoption suggest this downturn might just be another buying opportunity in disguise.
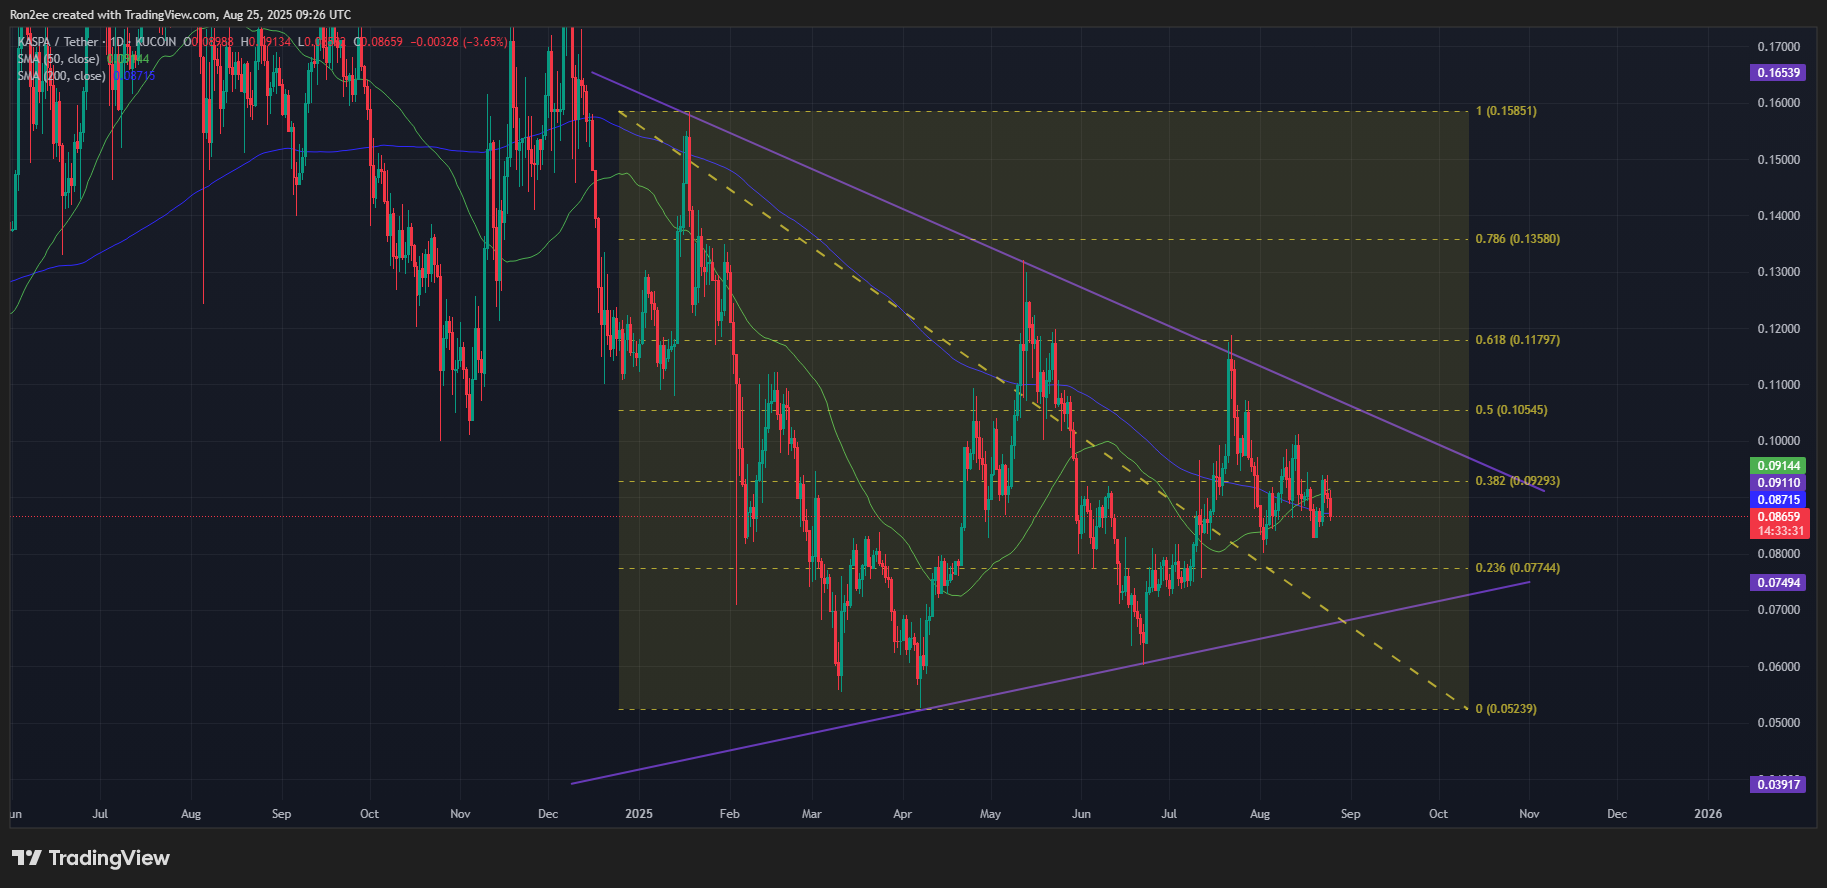
 Kaspa price has formed a symmetrical triangle pattern on the daily chart — Aug. 25 | Source: crypto.news
A breakout above the upper trendline WOULD signal a potential bullish reversal, whereas a breakdown below the lower trendline would likely confirm a continuation of the broader bearish trend, exposing the token to further downside risk.
To assess the likely direction of this breakout, additional technical indicators offer valuable insights.
The 50-day simple moving average has recently crossed above the 200-day SMA, forming a golden cross, a widely followed bullish signal that suggests positive momentum may be building. Historically, the last time Kaspa formed a golden cross, the token rallied by 74% over the following two months.
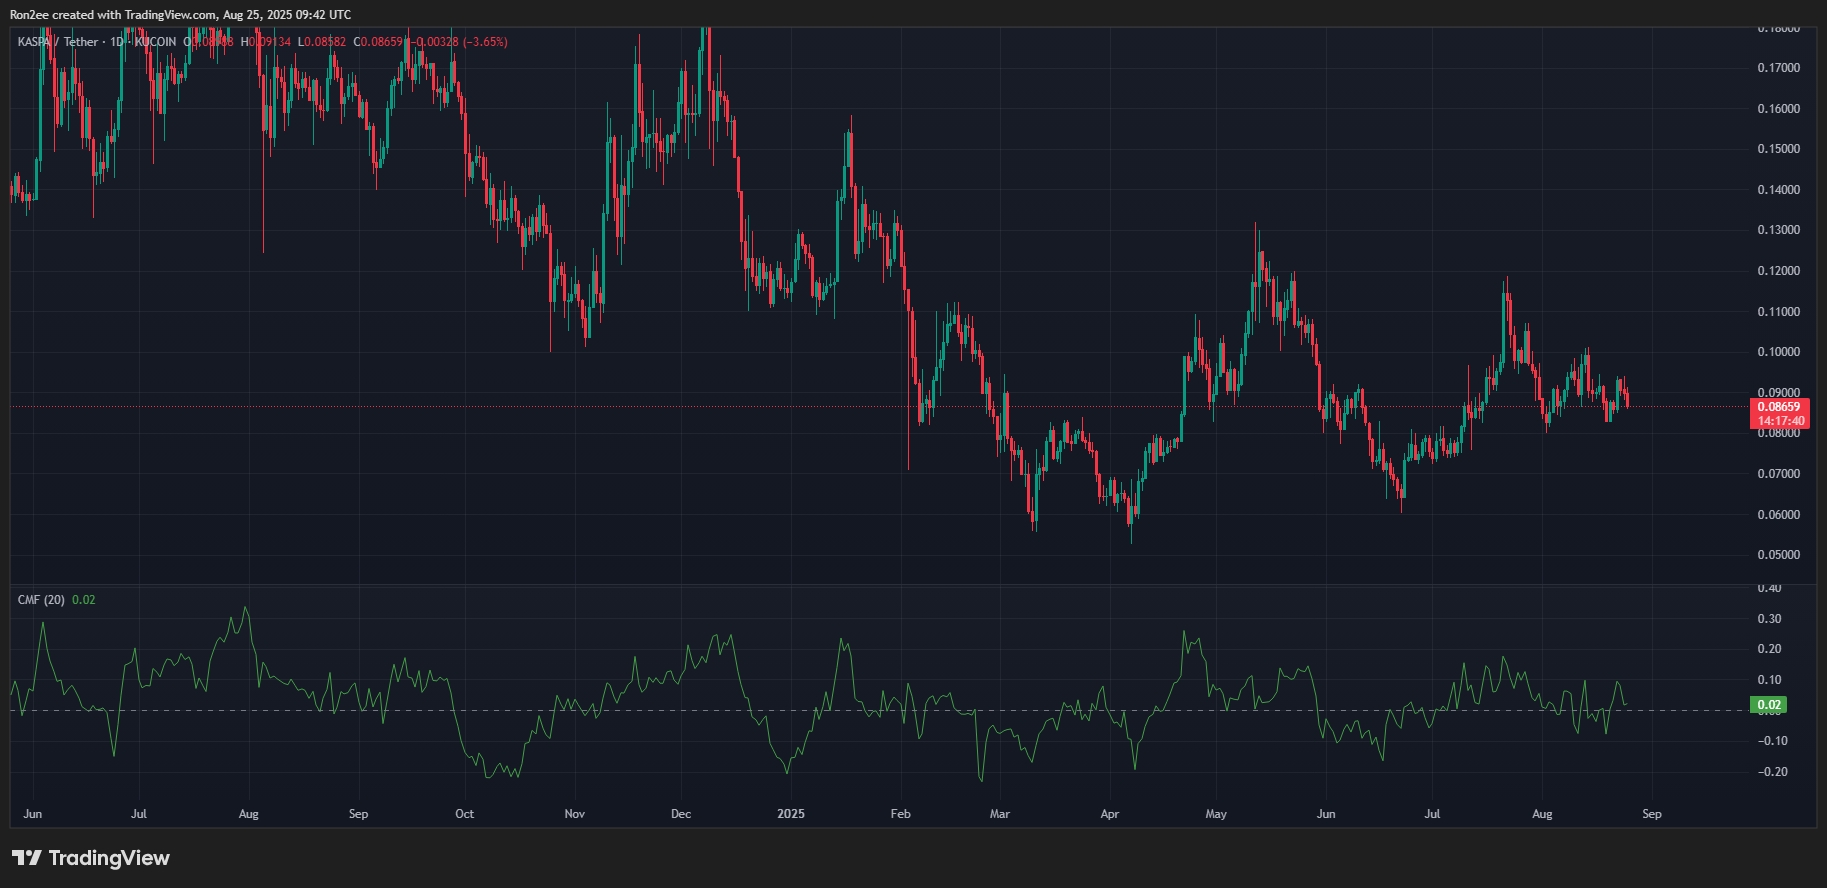
Additionally, the Chaikin Money FLOW index is currently showing a positive reading, indicating that buying pressure is outweighing selling pressure, a potential early sign of accumulation by market participants.

Based on these technical signals, a decisive breakout above $0.092, the upper boundary of the triangle, could open the path for a MOVE toward $0.10, a level that aligns closely with the 50% Fibonacci retracement from the January high to the April low. A confirmed breakout from the pattern could pave the way for further upside beyond that threshold.
Conversely, if KAS fails to hold the $0.082 support level, it could trigger renewed selling pressure and lead to a deeper correction, possibly retesting previous lows in the $0.070–$0.060 range.
Disclosure: This article does not represent investment advice. The content and materials featured on this page are for educational purposes only.

