Pi Network Price Eyes 150% Breakout as Rare Bull Pattern Emerges
Pi Network's chart flashes a signal traders haven't seen in years—and it's pointing straight up.
The Setup
A rare technical formation completes just as momentum indicators scream bullish. That 150% surge target isn't just hopeful thinking; it's what the pattern historically delivers.
Market Mechanics
Volume spikes confirm institutional interest while retail FOMO lurks. Key resistance levels crumble like a crypto influencer's credibility during a bear market.
The Bottom Line
Patterns promise—but markets deliver. This one suggests Pi's ready to defy the skeptics and punch well above its weight. Just remember: in crypto, 'rare patterns' are about as common as a trader who actually reads the whitepaper.
Pi Network price chart points to a surge

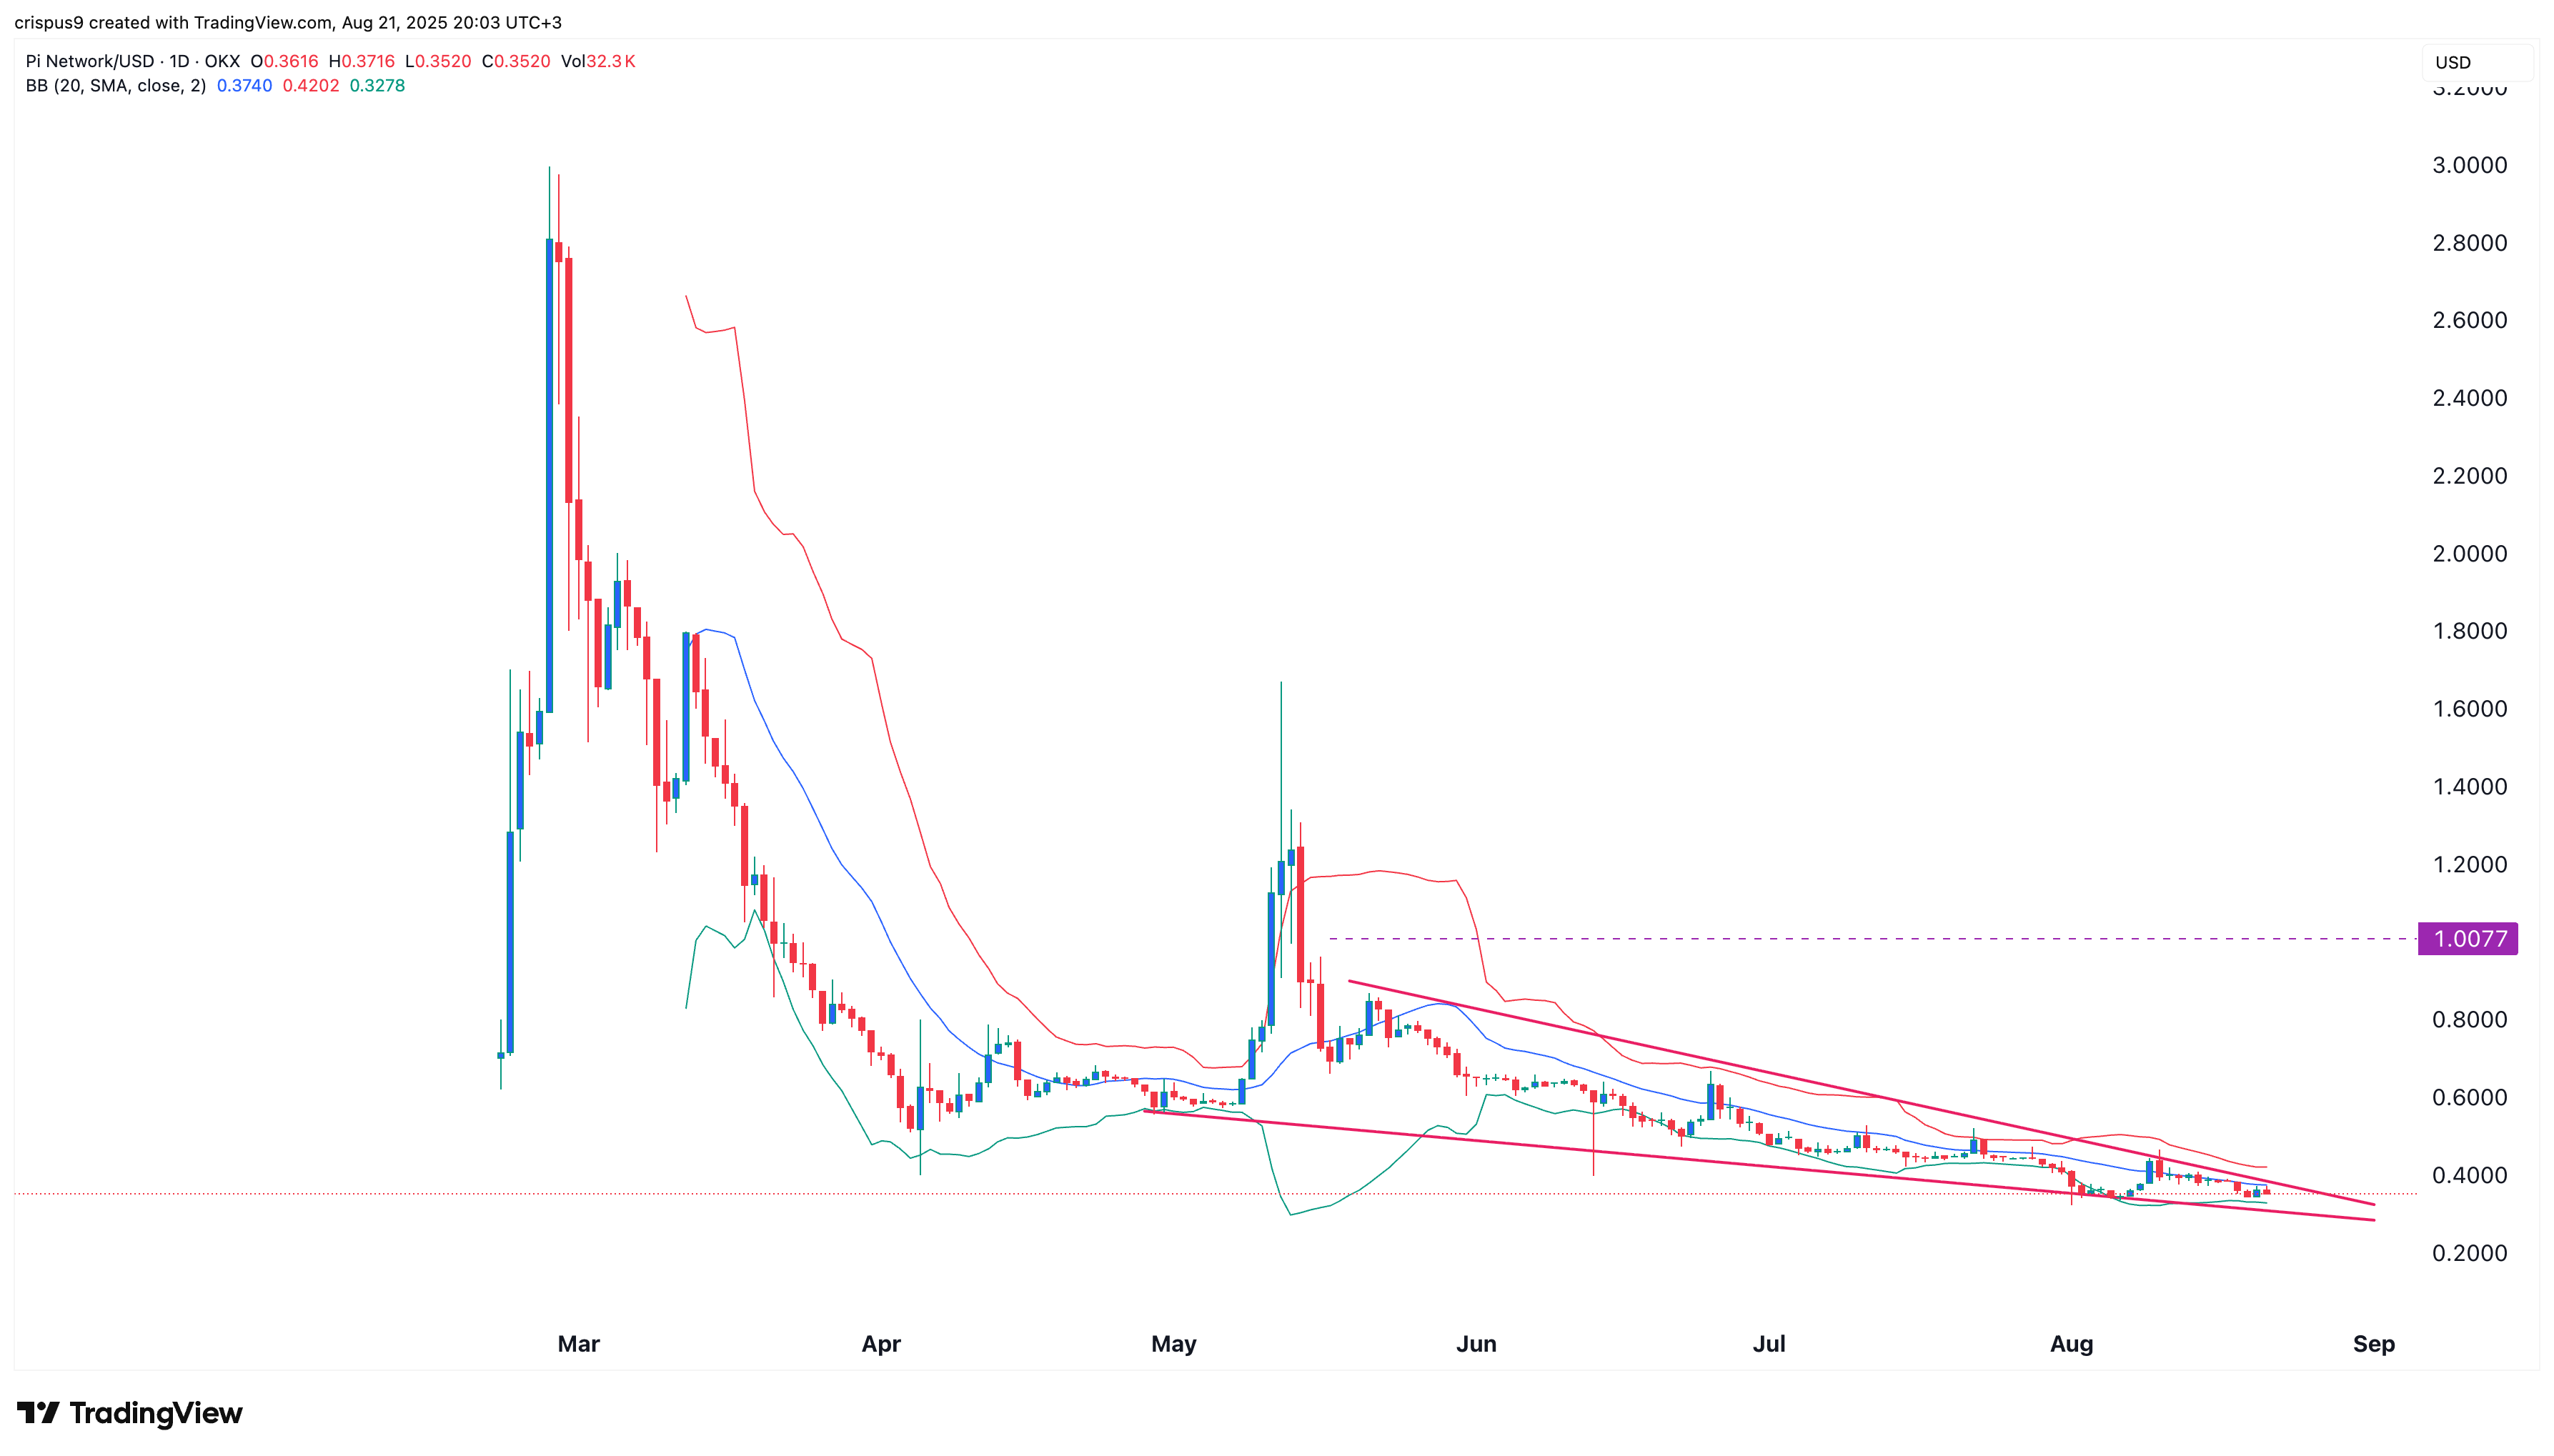
Technicals suggest the ongoing Pi Network price crash could be nearing its end after it formed a highly bullish falling wedge chart pattern on the daily chart. The wedge is characterized by two descending and converging trendlines.
A bullish breakout normally happens when these two lines are about to converge, which has already happened.
Another bullish catalyst is that the three lines of the Bollinger Bands are about to converge as the spread narrows. This performance is usually a sign that an asset has little volatility, which may lead to a strong bullish breakout.
If this happens, the Pi Coin price will likely have a strong bullish breakout, potentially to the resistance level at $1, which is about 150% above the current level.

