XRP Plunges 16% in 30 Days—Is a Deeper Correction Looming?

XRP's brutal selloff rattles crypto traders as technical support levels crumble.
Market Momentum Shifts
The token's 16% monthly decline signals weakening bullish sentiment amid broader market uncertainty. Trading volumes spike as panic sets in—typical crypto behavior where fear outperforms fundamentals.
Technical Breakdown
Key support zones shattered like cheap dinnerware at a bull convention. Chart patterns now suggest cascading sell orders could trigger another leg down. Because nothing says 'sound investment' like double-digit monthly losses.
Regulatory Shadow Boxing
Ongoing SEC theatrics continue haunting XRP's price action. The regulatory circus ensures volatility remains the only guaranteed feature—who needs stability when you've got legal drama?
Trader Psychology Turns Sour
Fear-to-greed ratios flip violently as bagholders reconsider life choices. The 'buy the dip' crowd now whispers about capitulation events. Because in crypto, 'correction' is just a polite term for watching your portfolio bleed out.
Bottom Line: XRP's bleeding might need more than a Band-Aid. But hey—at least the volatility makes traditional stocks look comatose.
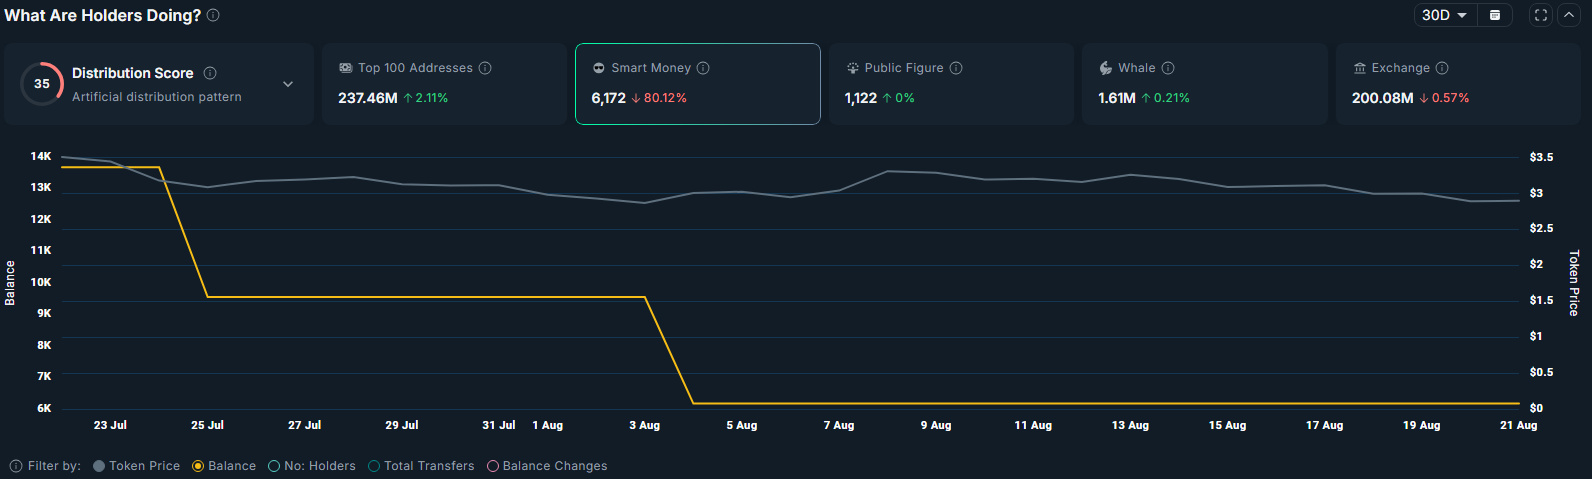 Source: Nansen
Additional data from CoinGlass shows that futures traders have also turned bearish. Open interest for XRP had fallen from $10.94 billion in July to $7.56 billion at press time, a sign of reduced speculation from investors.
Furthermore, the long/short ratio was below 1, which means more traders were positioned for a potential downside.
All of this has been unraveling as the network has been witnessing subdued activity on the XRP Ledger. Data from Dune show that weekly transactions have slumped 14.8% to 12.4 million, while weekly active addresses dropped 2.1% to 107,340. Investors view the slowdown as a sign of weakening network demand, adding to bearish sentiment around the token.
XRP price analysisOn the daily chart, XRP has fallen below the 20-day and 50-day moving averages, indicating that bearish momentum currently dominates.
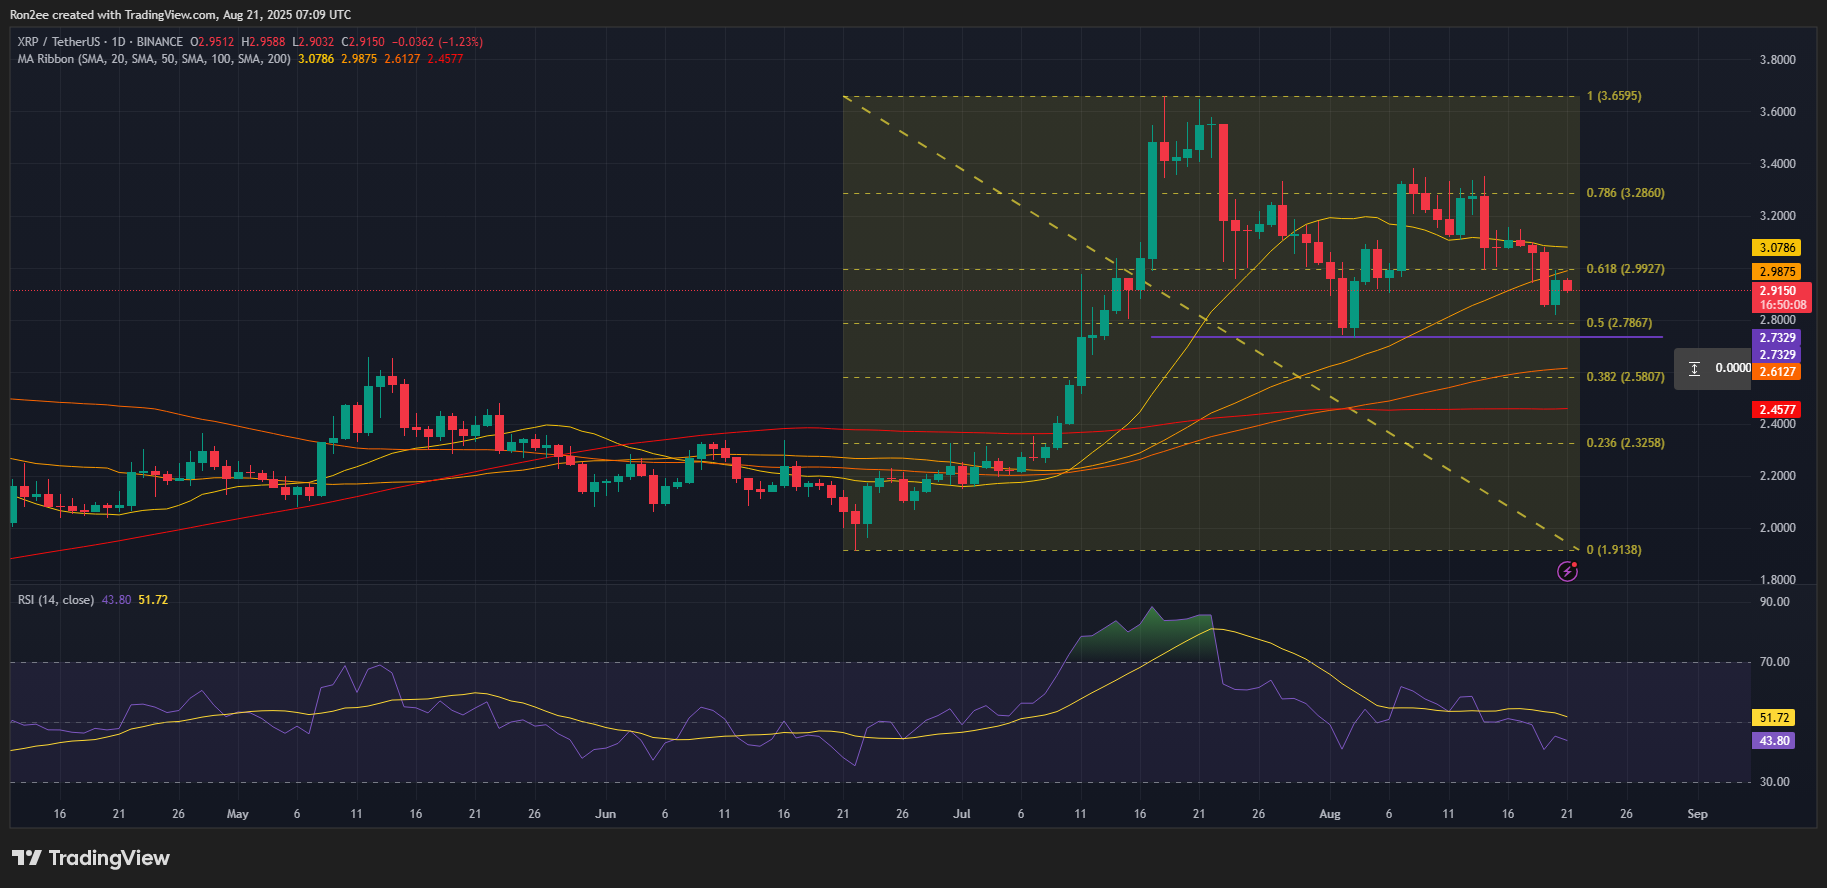
The Relative Strength Index has also formed a bearish divergence with price action. Such a divergence typically reflects weakness in the prevailing uptrend, as rising RSI values fail to confirm higher price levels. This dynamic often leads traders to take profits, signaling declining investor interest and the onset of buyer exhaustion.
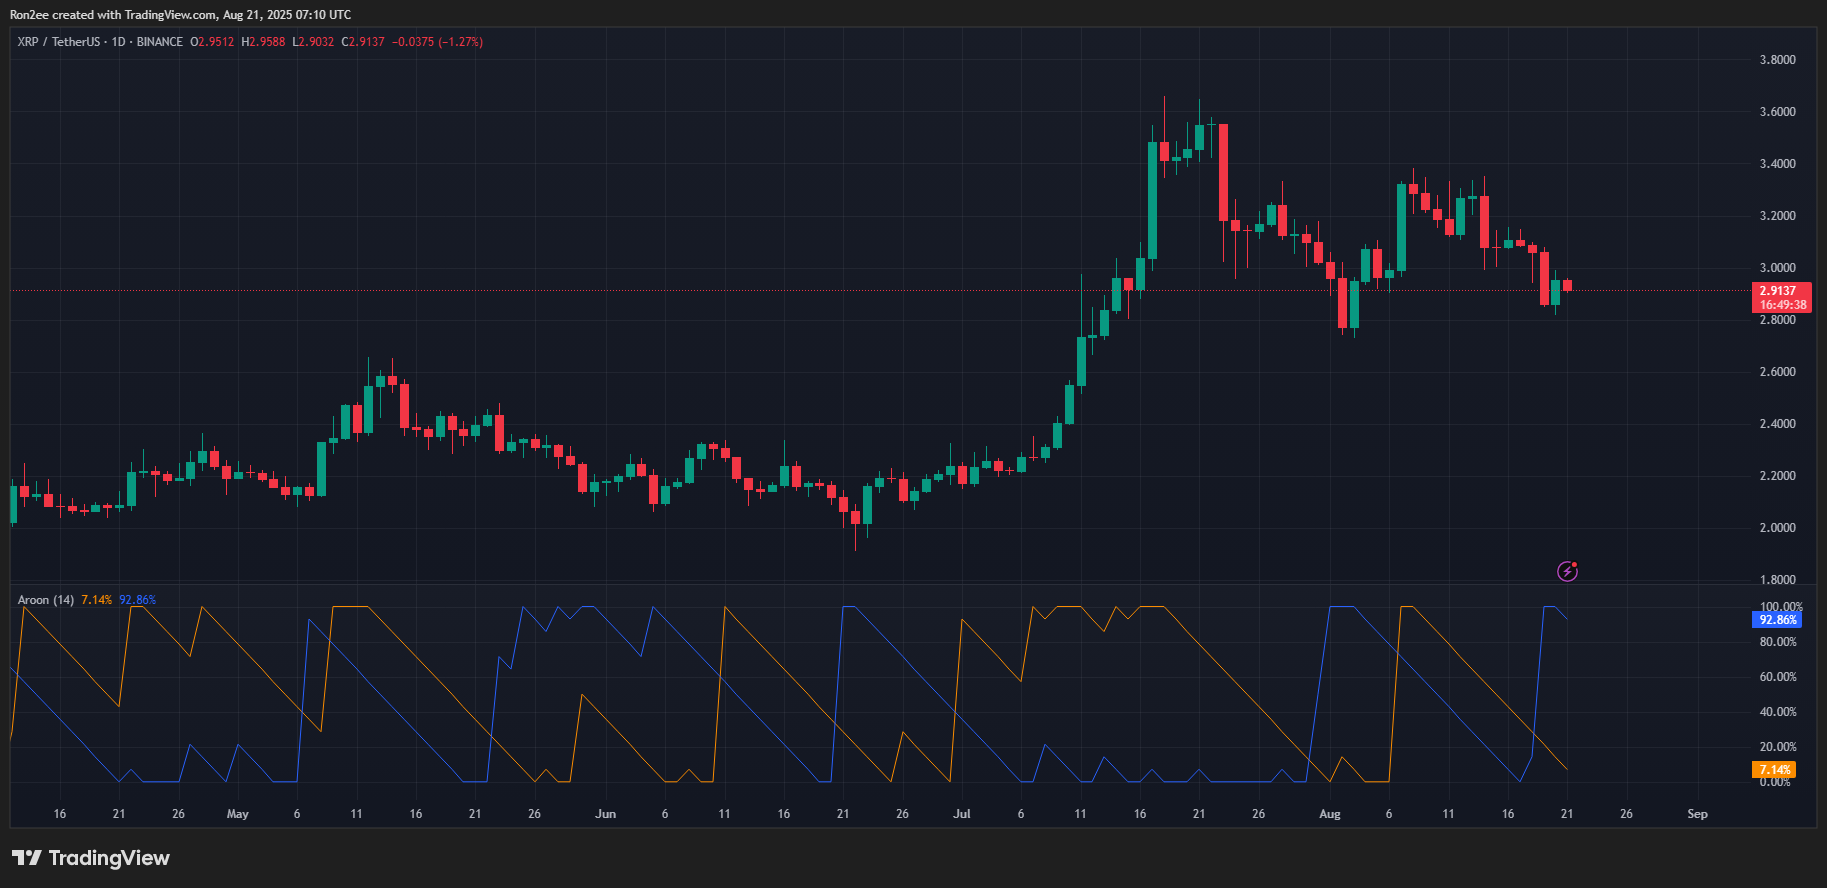
In addition, the Aroon Down indicator stands at 92.86% while the Aroon Up remains at 7.14%, reinforcing the strength of the bearish trend.
Given these signals, XRP is positioned for a potential correction toward $2.70, a level that previously acted as key support during its August decline.
A decisive break below this threshold could open the way for a further drop toward $2.30, which coincides with the 23.6% Fibonacci retracement level.
Disclosure: This article does not represent investment advice. The content and materials featured on this page are for educational purposes only.
