🚀 Hyperliquid Smashes ATH in Daily Volume & Fees — Is $HYPE Primed for a Mega Rally?

Hyperliquid just flexed its muscles with record-breaking daily volume and fee generation. The perpetuals-focused DEX is riding DeFi's latest liquidity wave—but can its native token $HYPE convert momentum into sustainable gains?
When Derivatives Go Mainstream
Traders piled into Hyperliquid's leveraged positions as crypto volatility returned with a vengeance. The platform's lean infrastructure—built to bypass CEX bottlenecks—handled the surge without breaking a sweat.
The Real Test Ahead
While the metrics dazzle, $HYPE's tokenomics face scrutiny. Like most exchange tokens, it's caught between being a governance placeholder and a speculative asset—Wall Street would call this 'creative accounting,' but in crypto, we call it Tuesday.
One thing's certain: When the perpetuals market heats up, Hyperliquid's proving it can hang with the big boys. Whether that translates to long-term value? That's the billion-dollar question.
Institutional momentum and liquidity growth
According to DefiLlama data, Hyperliquid’s total value locked increased to $610 million from about $460 million in mid-July. Additionally, July saw a sharp increase in monthly USD inflows, which went from $21.35 million in June to $349.27 million.
Recent developments have sped up the momentum. On July 31, Circle announced that native USD Coin (USDC) and CCTP V2 will launch on Hyperliquid, enabling direct on/off ramps, cross-chain transfers, and improved liquidity for the decentralized finance and derivatives markets.
Adoption by institutions is also growing. Anchorage Digital Bank unveiled on Aug. 13 that it WOULD provide custody for Hyperliquid’s native HYPE token, offering institutional-grade security on HyperEVM.
Hyperliquid technical analysis
Strong bullish signals are supporting the price action of HYPE. From the 200-day SMA to the 10-day EMA, all of the major moving averages point to a buy trend.
At 63, the relative strength index is still in neutral territory, leaving opportunity for more upside before it reaches overbought conditions. The moving average convergence divergence is positive, and the stochastic at 87.81 suggests ongoing buying interest.
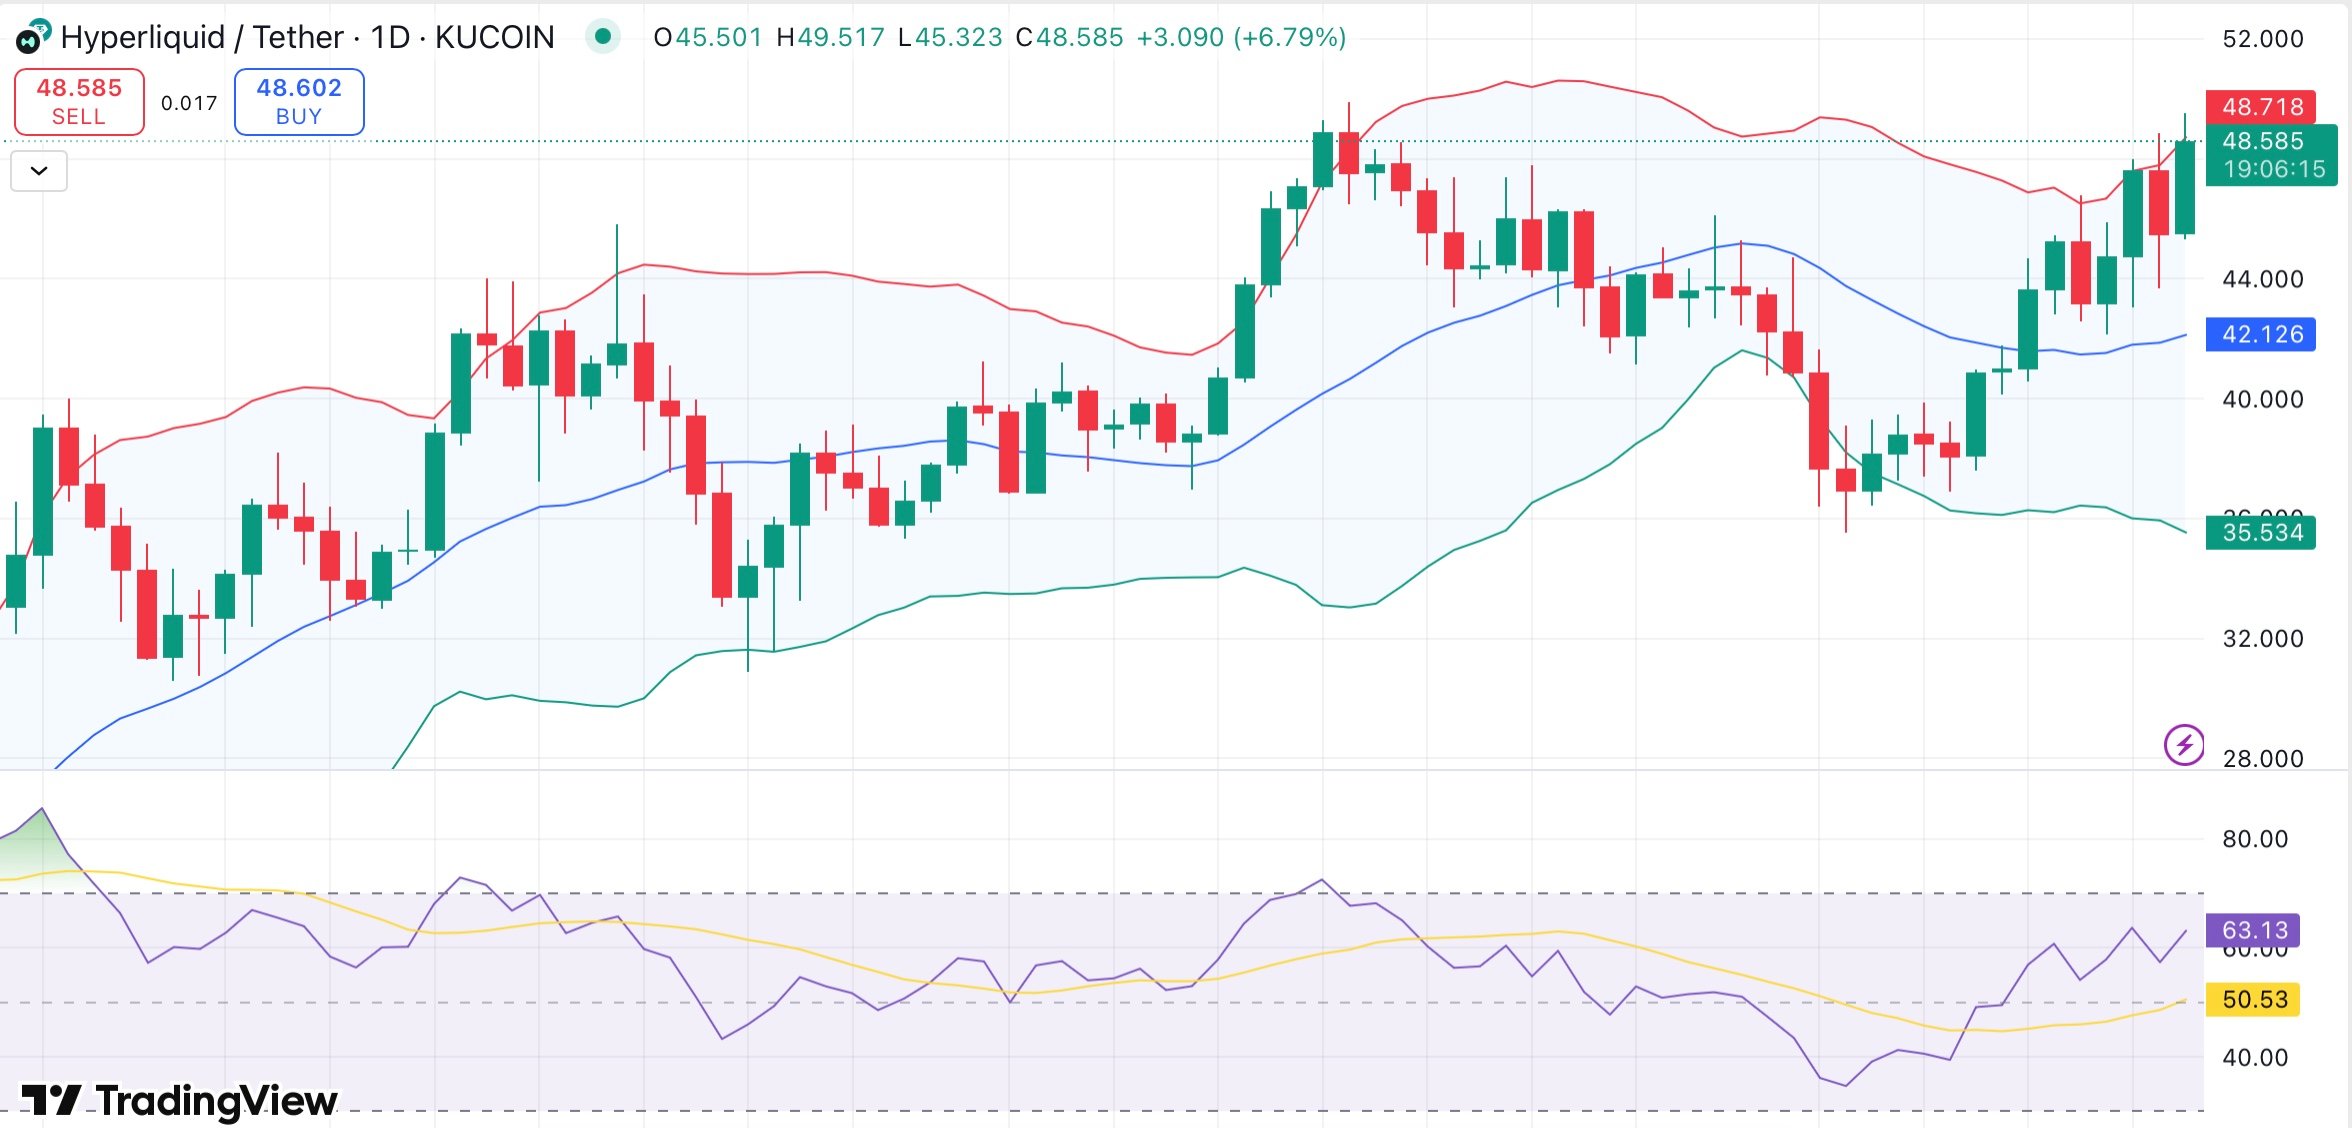
The Bollinger Bands are narrowing, and the price is pushing against the upper band, This indicates a tightening of volatility, which often precedes a breakout. Upward targets might emerge NEAR $55 if the token closes firmly above $49.75, with $52 acting as intermediate resistance,
Support is located at $45, and a stronger demand area is located at $42, which corresponds to the 20-day EMA and the mid-Bollinger band. Since the average directional index is still in its early stages of a trend, if volume keeps growing, there may be potential for a more strong directional move.
