Bitcoin Shatters Records: New ATH Sparks Bullish Frenzy – What’s the Next Catalyst?

Bitcoin just bulldozed through its previous peak, leaving traders scrambling and skeptics eating crow. The king of crypto isn’t just back—it’s rewriting the rules.
### The FOMO Is Real
Retail investors are piling in like it’s 2021, while Wall Street’s latecomers frantically overpay for ETF exposure. Meanwhile, the ‘digital gold’ narrative gains steam as traditional markets wobble.
### Liquidity Tsunami Ahead?
With institutional adoption accelerating and halving-induced scarcity kicking in, this rally might have legs. Or it’s another pump before the inevitable ‘correction’—because finance loves its cyclical sob stories.
### The Cynic’s Corner
Some hedge fund manager is probably blaming Bitcoin for their third yacht’s depreciation. Meanwhile, the rest of us stack sats.
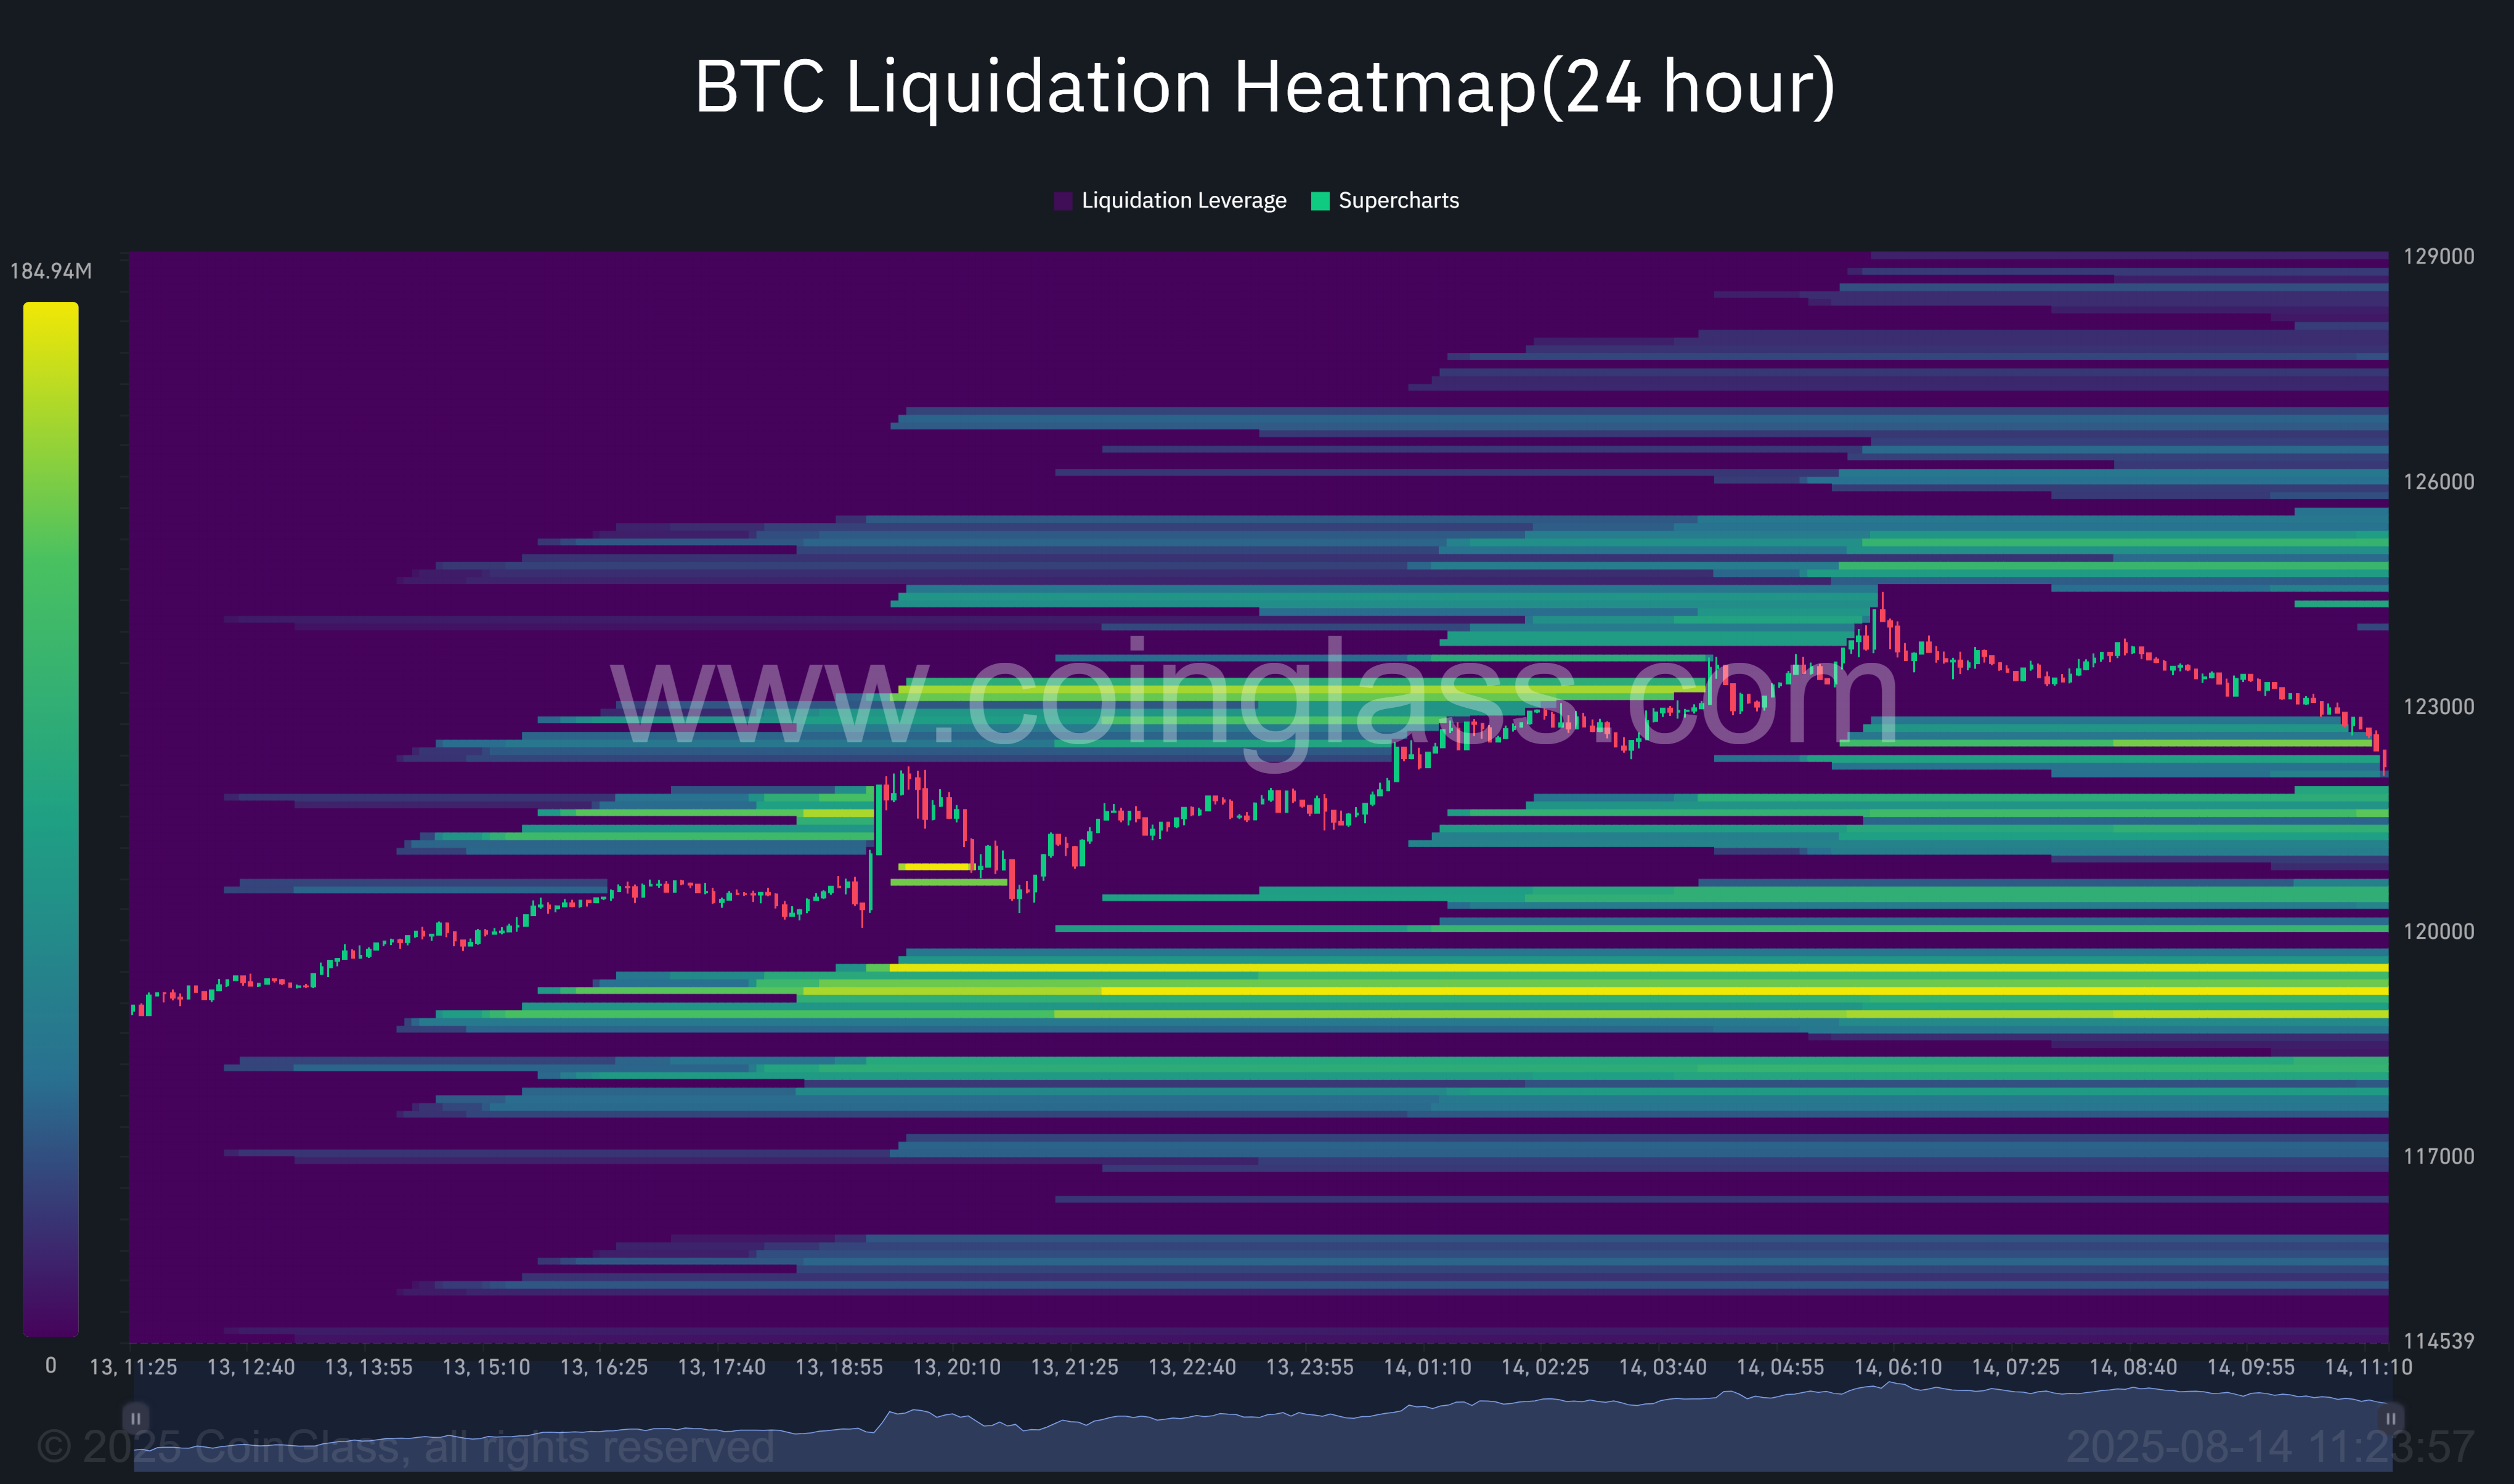 Bitcoin liquidation heatmap | Source: CoinGlass
However, the chart also reveals a dense concentration of long liquidation levels clustered around $120,000–$121,000. If the price were to retrace into this zone, it could trigger a cascade of forced selling, accelerating downside pressure.
BTC price analysis
Bitcoin appears to have formed an ascending parallel channel pattern on the 4-hour chart, which consists of higher highs and higher lows contained within two upward-sloping parallel lines. This formation typically signals a continuation of the prevailing uptrend.
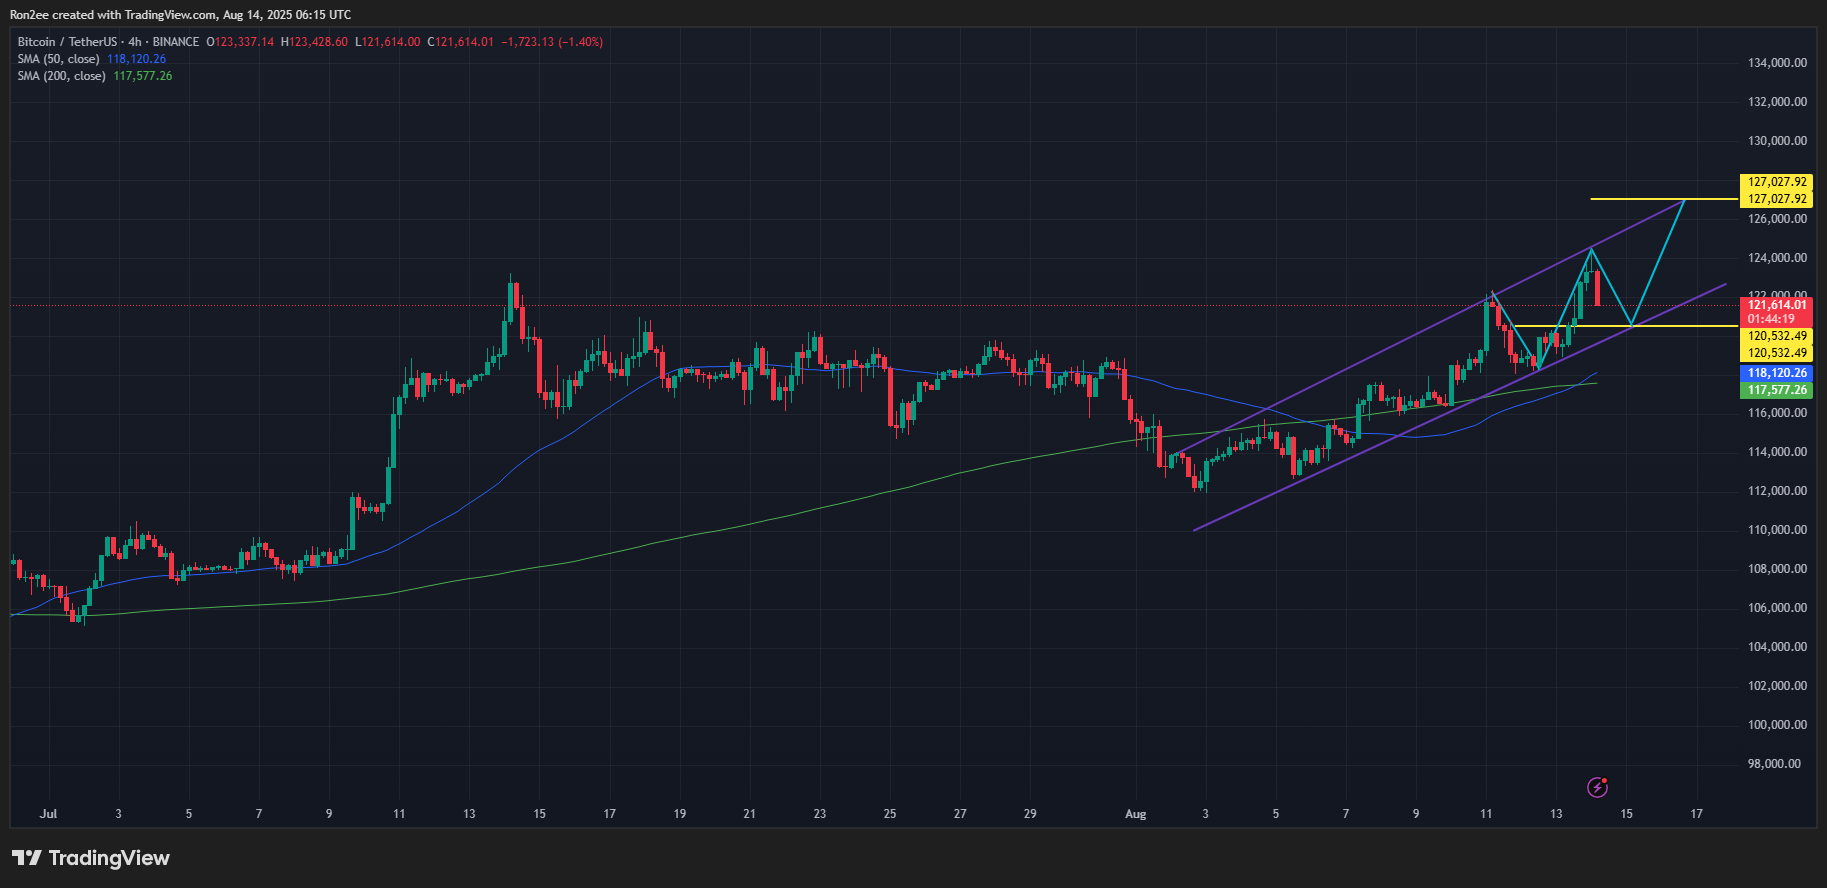
The token’s price is currently retracing after touching the channel’s upper boundary, with a move toward approximately $120,500 likely by the end of the current session. If BTC holds support at this level, it could rebound toward $127,000 in the next leg higher, assuming it continues to trade within the channel.
The bullish crossover of the 50-day moving average above the 200-day moving average further reinforces the upward bias, indicating sustained positive momentum in the trend.
Disclosure: This article does not represent investment advice. The content and materials featured on this page are for educational purposes only.
